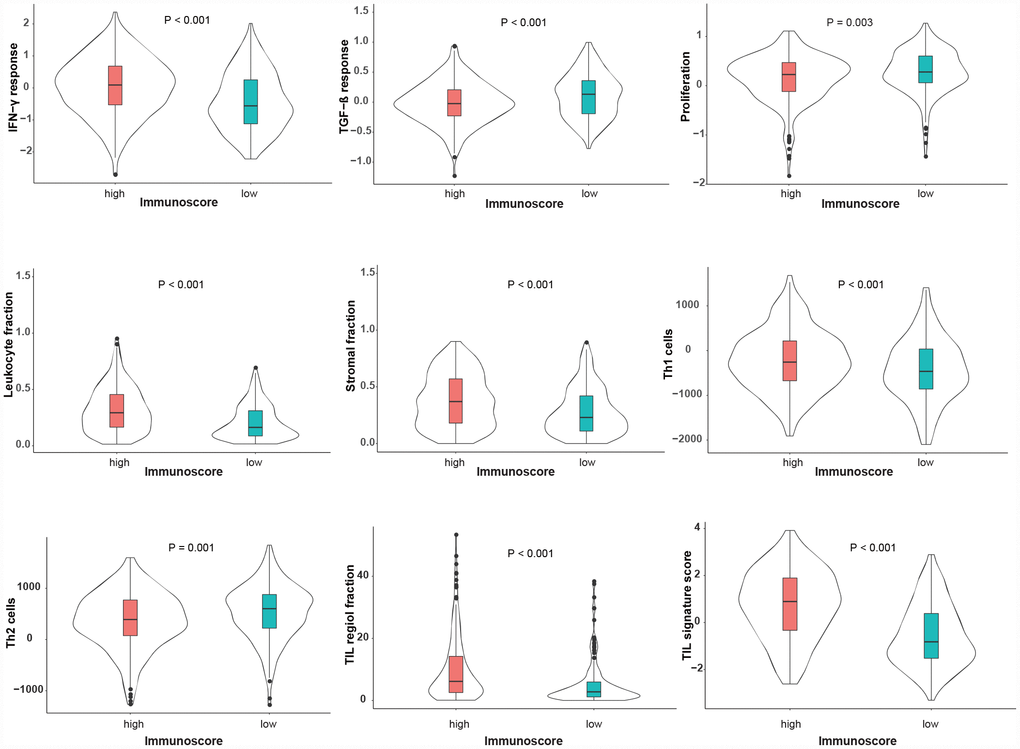
Figure 5.Immune-related features between high- and low-immunoscore groups in the TCGA dataset. These immune-related features are described according to the immune classification study of Thorsson et al. [34]. The P-values were calculated using one-way ANOVA.