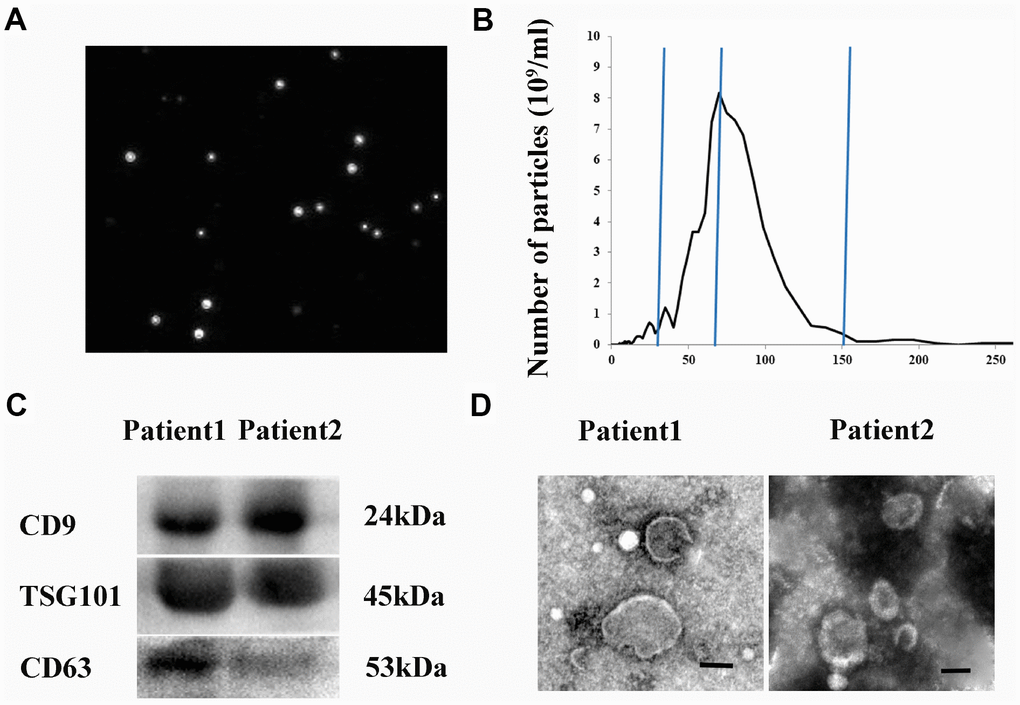
Figure 1.Isolation and characterization of hematoma-derived exosomes. (A) Representative images from NanoSight particle tracking analysis. (B) Size distribution of hematoma-derived exosomes. (C) Expression of CD9, CD63, and TSG101 in hematoma-derived exosomes. (D) Representative TEM image of exosomes. Scale bar: 100 nm.