Submit an Article
Navigate
Home
Editorial Board
Editorial Policies
Current Volume
Archive
Scientific Integrity
Publication Ethics Statements
Interviews with Outstanding Authors
Newsroom
Sponsored Conferences
Podcast
Contact
Special Collections
Submit an Article
Online ISSN: 1945-4589
Research Paper
|
Volume 11, Issue 23
|
pp. 11474–11489
Prognostic value of immune-related genes in clear cell renal cell carcinoma
Back to article
Figure 10
(10 of 13)
−
100%
+
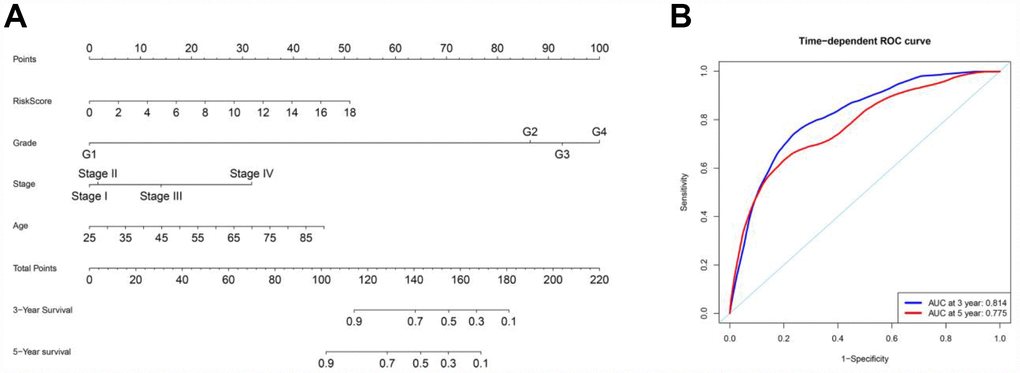
Figure 10.
Nomogram and ROC curves for the prediction of prognosis at three and five years in the entire TCGA cohort.
(
A
) Nomogram for OS. (
B
) ROC curves for OS.