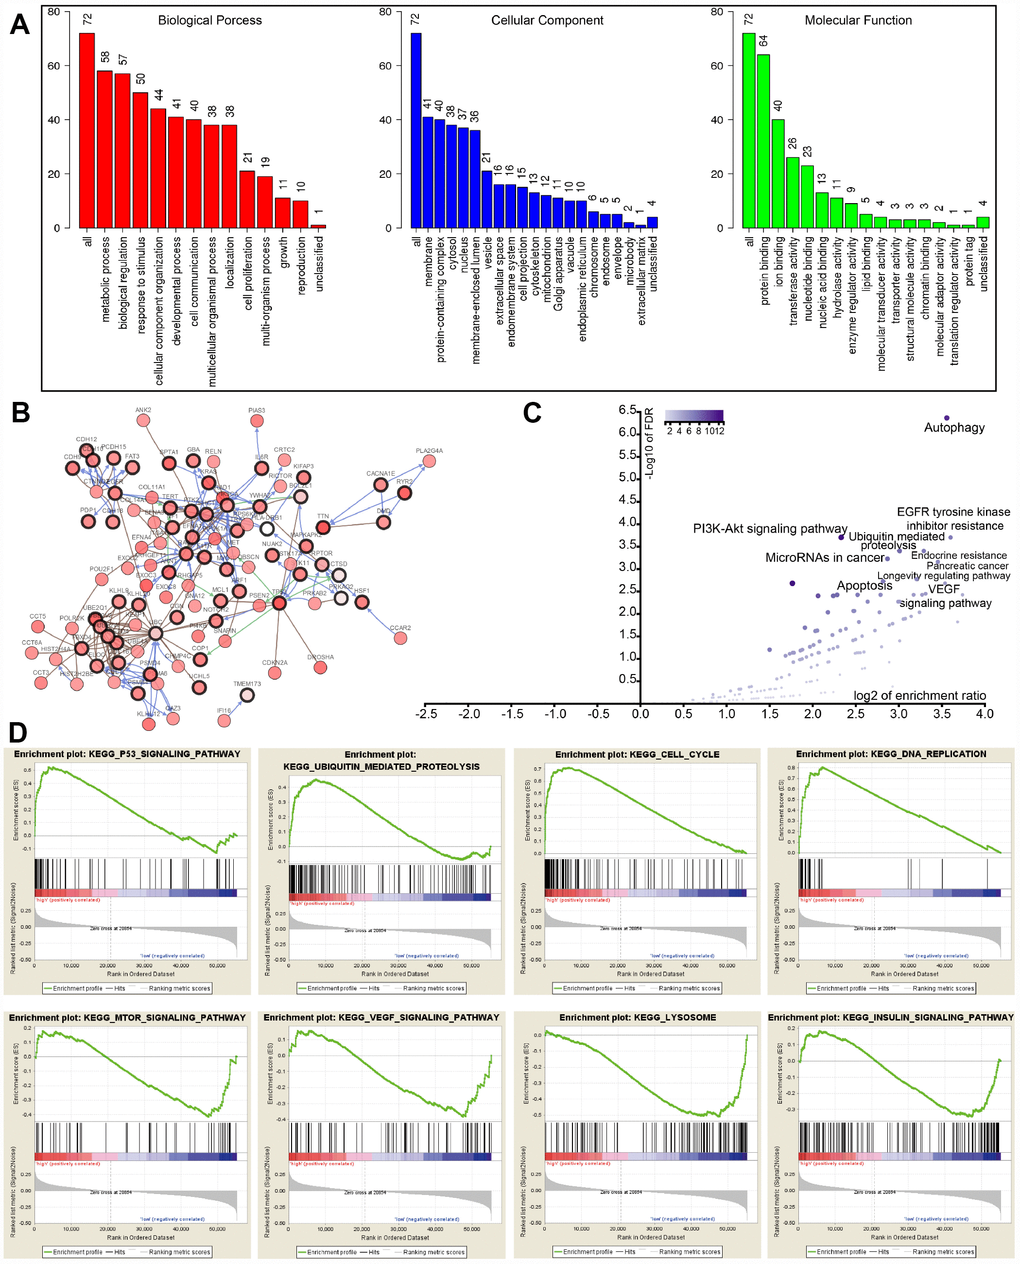
Figure 5.GO, KEGG, and GSEA analysis. (A) GO analysis of 22 autophagy-associated genes and 50 altered neighbor genes. (B) Proteins interacted with the 22 autophagy-associated genes (black circle) in TCGA-LUAD. (C) Volcano of autophagy genes-associated pathways. (D) GSEA analysis of the differentially expressed genes between high and low risk groups.