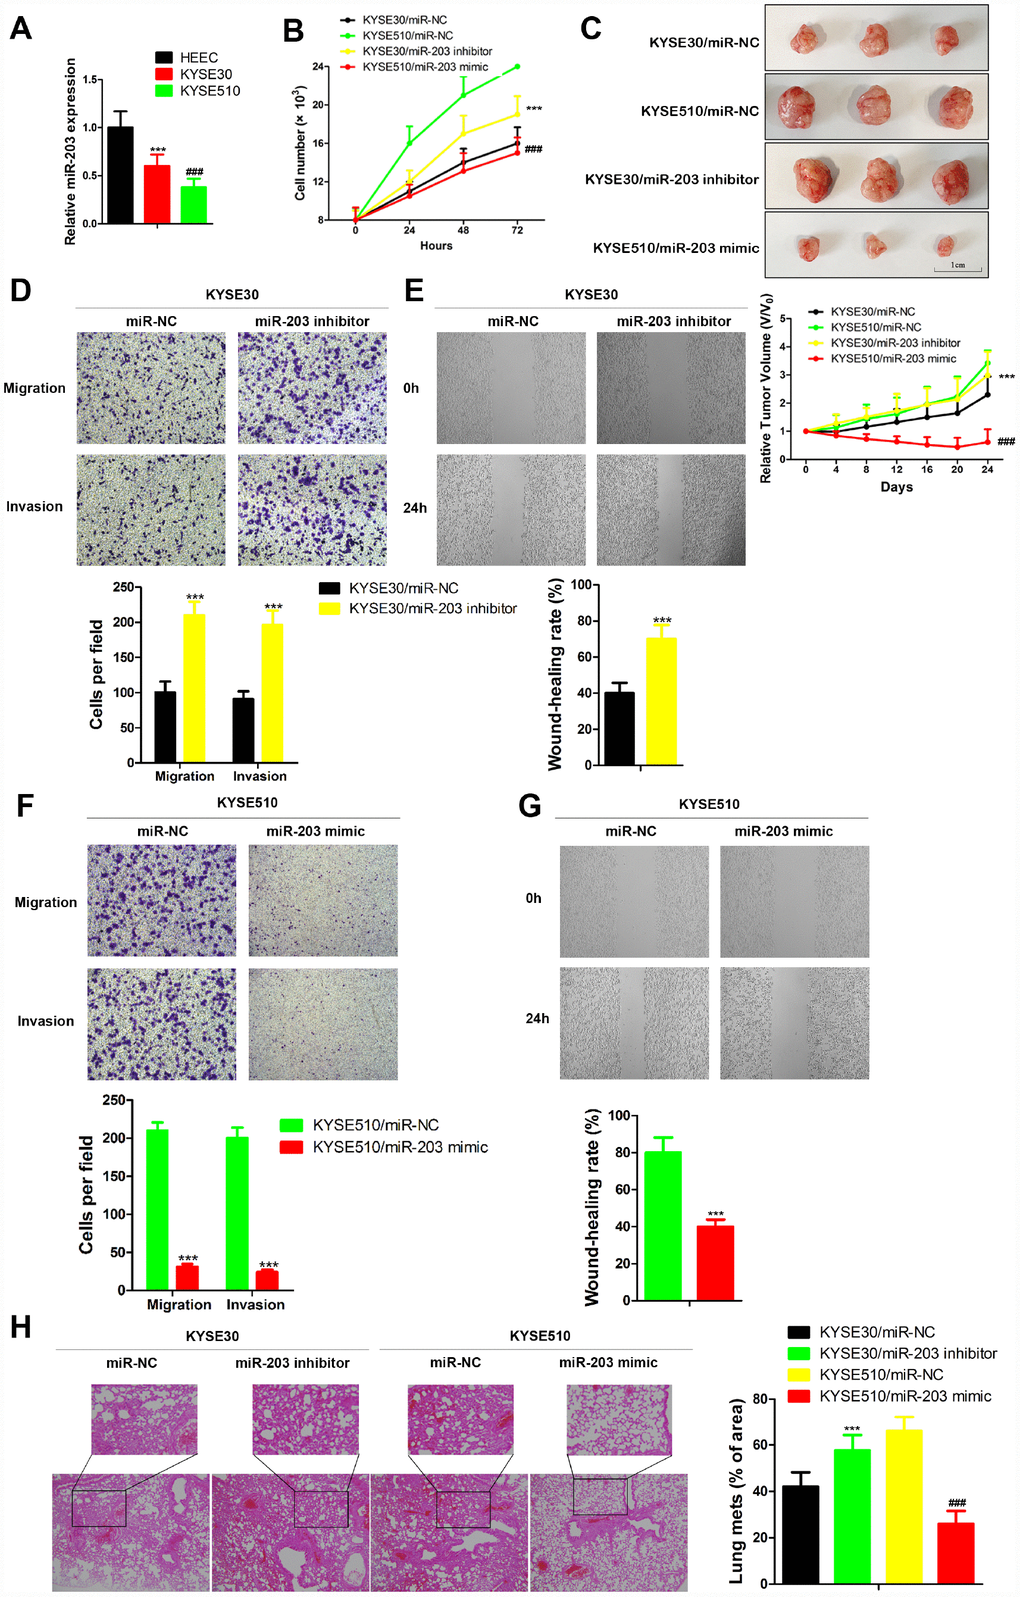
Figure 3.miR-203 inhibits proliferation, migration and invasion of EC cells in vivo and in vitro. (A) miR-203 expression in normal esophageal cell line HEEC and EC cell lines KYSE30 and KYSE510 was determined by qRT-PCR. Data is presented as mean ± SD from three independent experiments. ***p < 0.001 (HEEC vs. KYSE30), ###p < 0.0001 (KYSE510 vs. KYSE30). (B) Numbers of KYSE30 cells and KYSE510 cells were counted at indicated time post transfected with miR-203 inhibitor, miR-203 mimic or miR-203 negative control (miR-NC). Data is presented as mean ± SD from three independent experiments. ***p<0.001 (KYSE30/miR-203 inhibitor vs. KYSE30/miR-NC), ###p<0.0001 (KYSE510/miR-203 mimic vs. KYSE510/miR-NC). (C) Tumor volume changes of mice with different genetically modified cells. Data are presented as mean ± SD (n=10). ***p<0.001 (KYSE30/miR-203 inhibitor vs. KYSE30/miR-NC), ###p<0.0001 (KYSE510/miR-203 mimic vs. KYSE510/miR-NC). Cellular migration and invasion of KYSE30 cells were evaluated by transwell assays (D) and wound healing assay (E). Cellular migration and invasion of KYSE510 cells were evaluated by transwell assays (F) and wound healing assay (G). Quantification of the numbers of migrating or invading cells is presented as mean ± SD from three independent experiments (×100). ***p<0.01 (vs. negative control miR-NC). (H) The changes of lung metastasis of different genetically modified cells. Data is presented as mean ± SD from three independent experiments (×100). ***p<0.001 (KYSE30/miR-203 inhibitor vs. KYSE30/miR-NC), ###p<0.0001 (KYSE510/miR-203 mimic vs. KYSE510/miR-NC).