Submit an Article
Navigate
Home
Editorial Board
Editorial Policies
Current Volume
Archive
Scientific Integrity
Publication Ethics Statements
Interviews with Outstanding Authors
Newsroom
Sponsored Conferences
Podcast
Contact
Special Collections
Submit an Article
Online ISSN: 1945-4589
Research Paper
|
Volume 11, Issue 23
|
pp. 11111–11123
Daily decrease of post-operative alpha-fetoprotein by 9% discriminates prognosis of HCC: A multicenter retrospective study
Back to article
Figure 1
(1 of 3)
−
100%
+
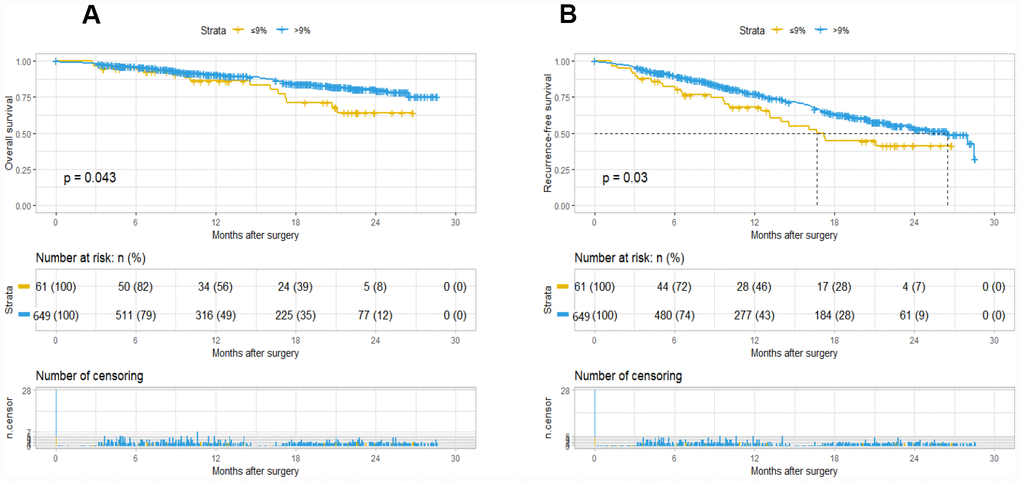
Figure 1.
Kaplan-Meier survival plot of OS and RFS based on A09.
The survival curve of overall survival (
A
) and recurrence-free survival (
B
).
Figure 1 — Daily decrease of post-operative alpha-fetoprotein by 9% discriminates prognosis of HCC: A multicenter retrospective study | Aging