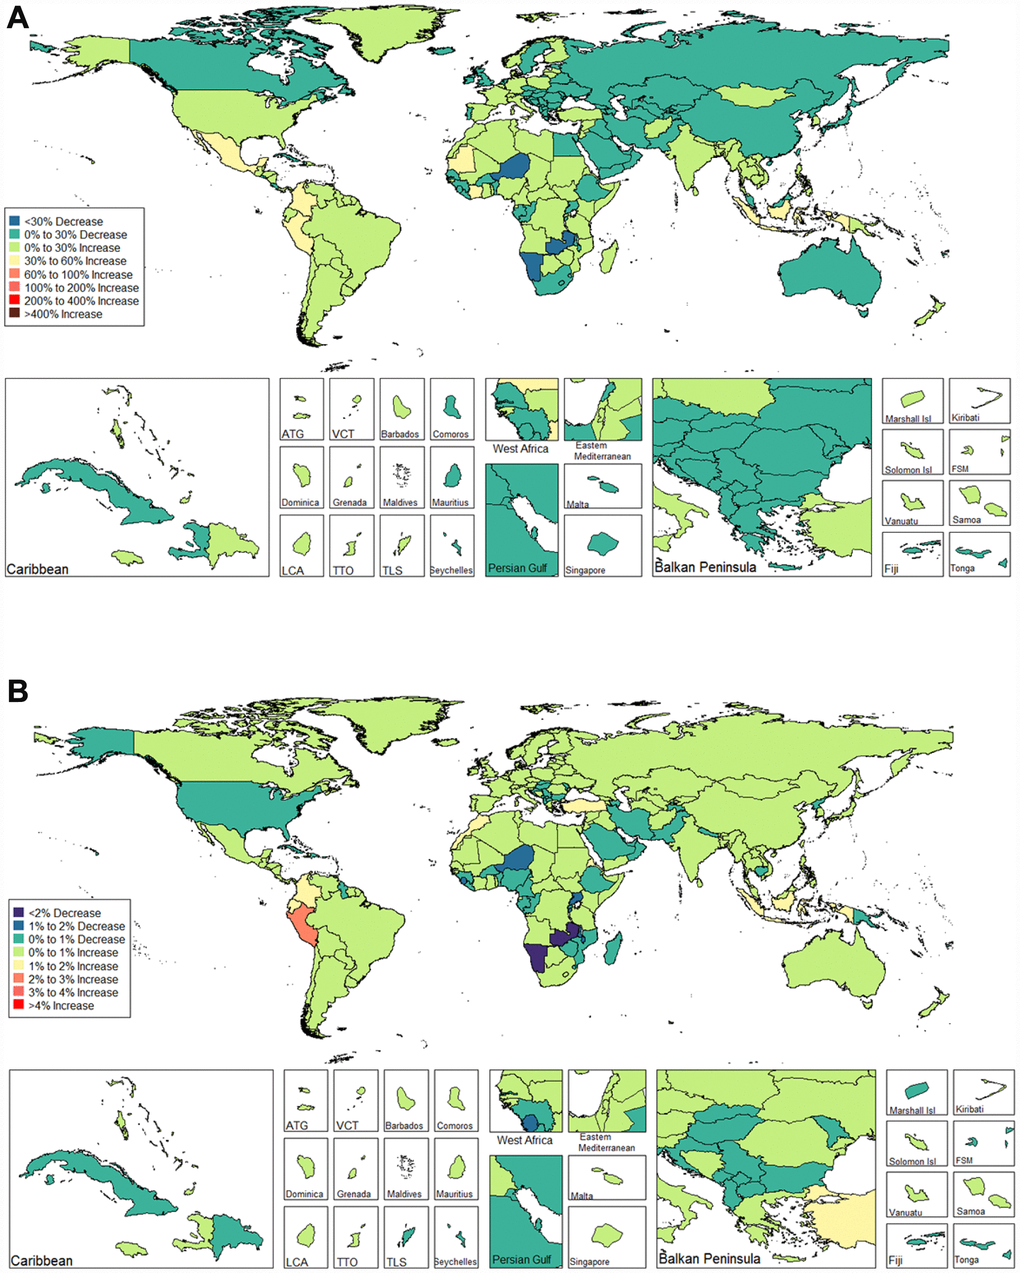
Figure 6.Global disease burden of male infertility prevalence in 195 countries and territories. (A) The percent change in age-standardized prevalence of male infertility between 1990 and 2017; (B) The estimated annual percentage change of male infertility age-standardized prevalence from 1990 to 2017).