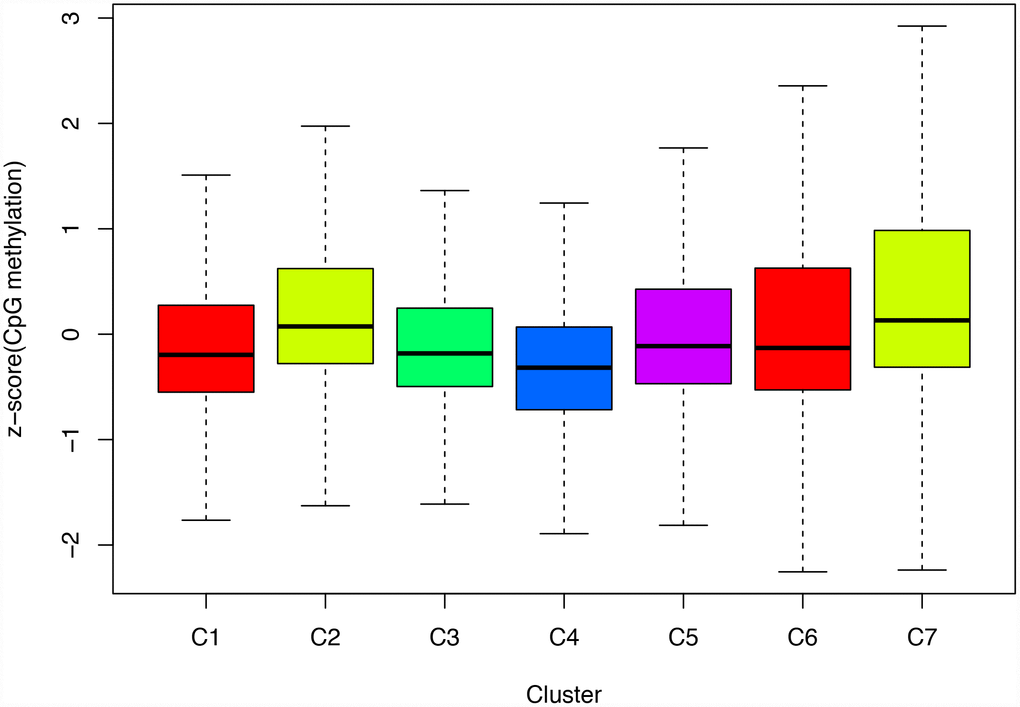
Figure 9.Stability of the prognosis prediction model in testing set colon adenocarcinoma patients. (A) The horizontal axis represents the samples, and the vertical axis represents methylation site. (B) Analysis of prognostic differences after classification in the testing set.