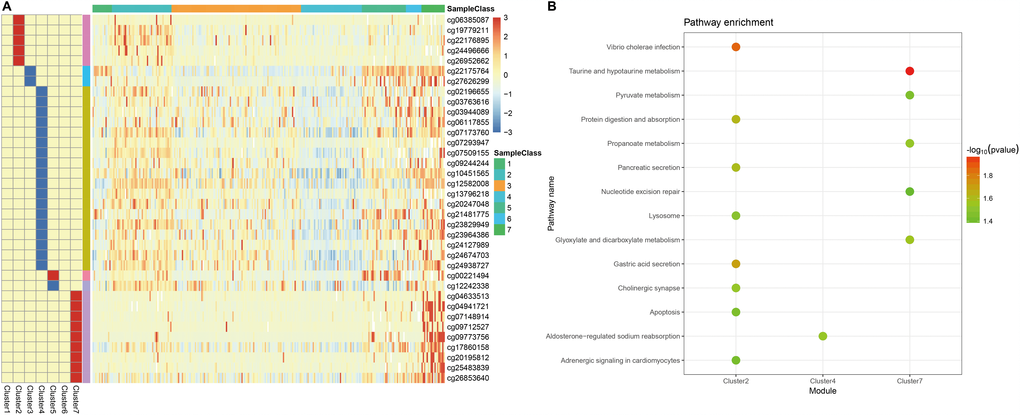
Figure 5.Specific hyper/hypo-methylation CpG sites for each DNA methylation cluster. (A) Specific CpG sites are shown for each DNA methylation prognosis subtype. Red and blue bars represent hyper- and hypomethylation CpG sites, respectively. (B) KEGG pathway enrichment analysis of specific CpG sites.