Submit an Article
Navigate
Home
Editorial Board
Editorial Policies
Current Volume
Archive
Scientific Integrity
Publication Ethics Statements
Interviews with Outstanding Authors
Newsroom
Sponsored Conferences
Podcast
Contact
Special Collections
Submit an Article
Online ISSN: 1945-4589
Research Paper
|
Volume 11, Issue 23
|
pp. 10861–10882
Glycolysis gene expression profilings screen for prognostic risk signature of hepatocellular carcinoma
Back to article
Figure 2
(2 of 12)
−
100%
+
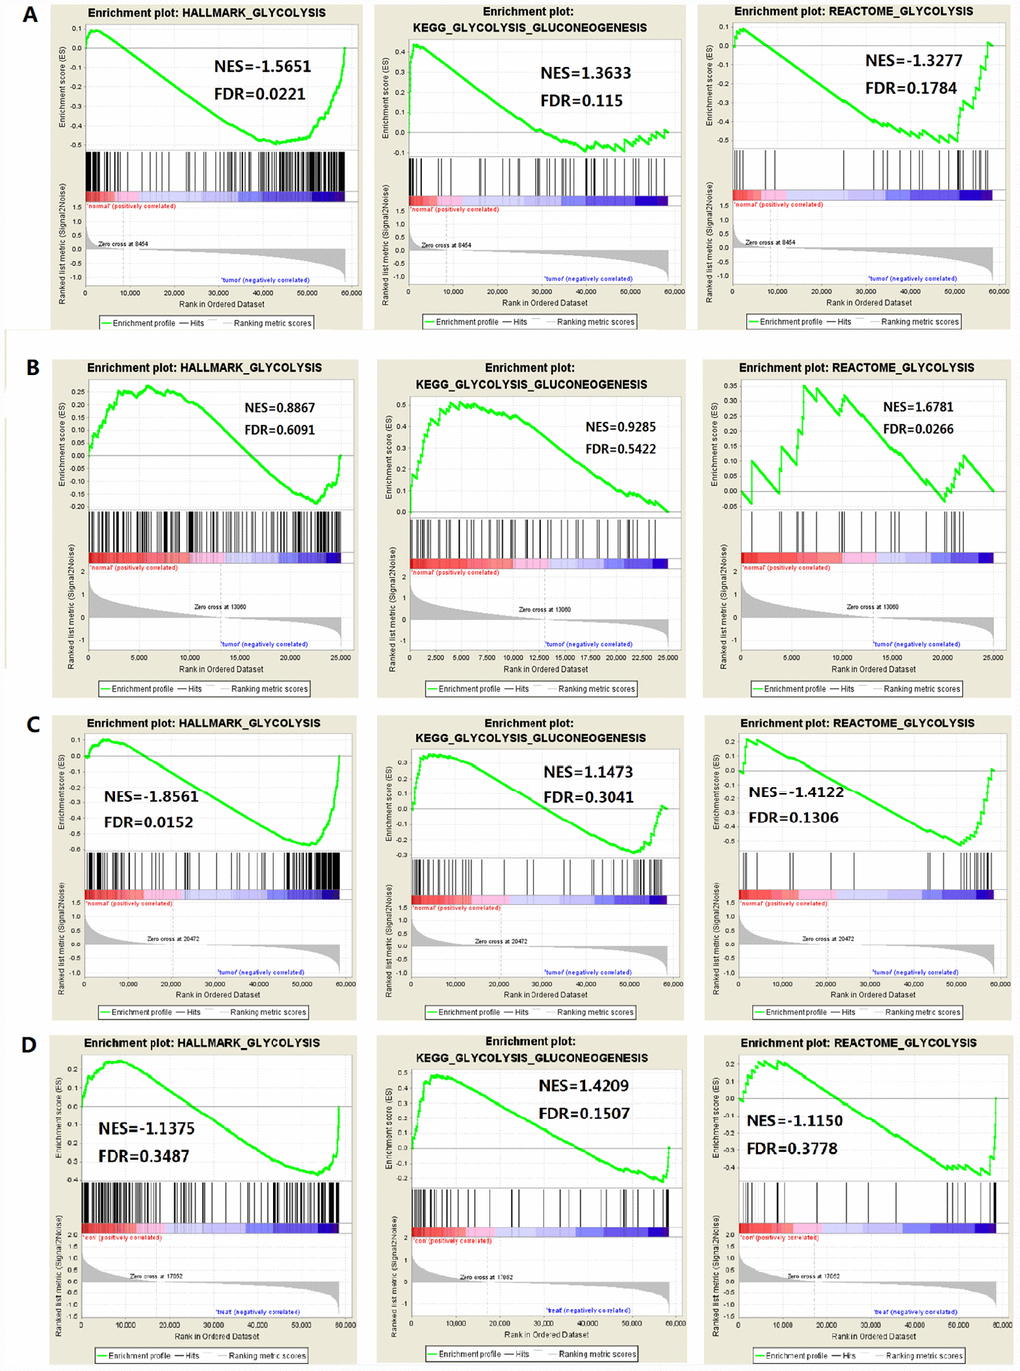
Figure 2.
Enrichment plots of three glycolysis-related gene sets in each tumor (FDR is the P value after correction by multiple hypothesis test).
(
A
) HCC, (
B
) Colorectal adenocarcinoma, (
C
) Breast invasive carcinoma, (
D
) Renal clear cell carcinoma.