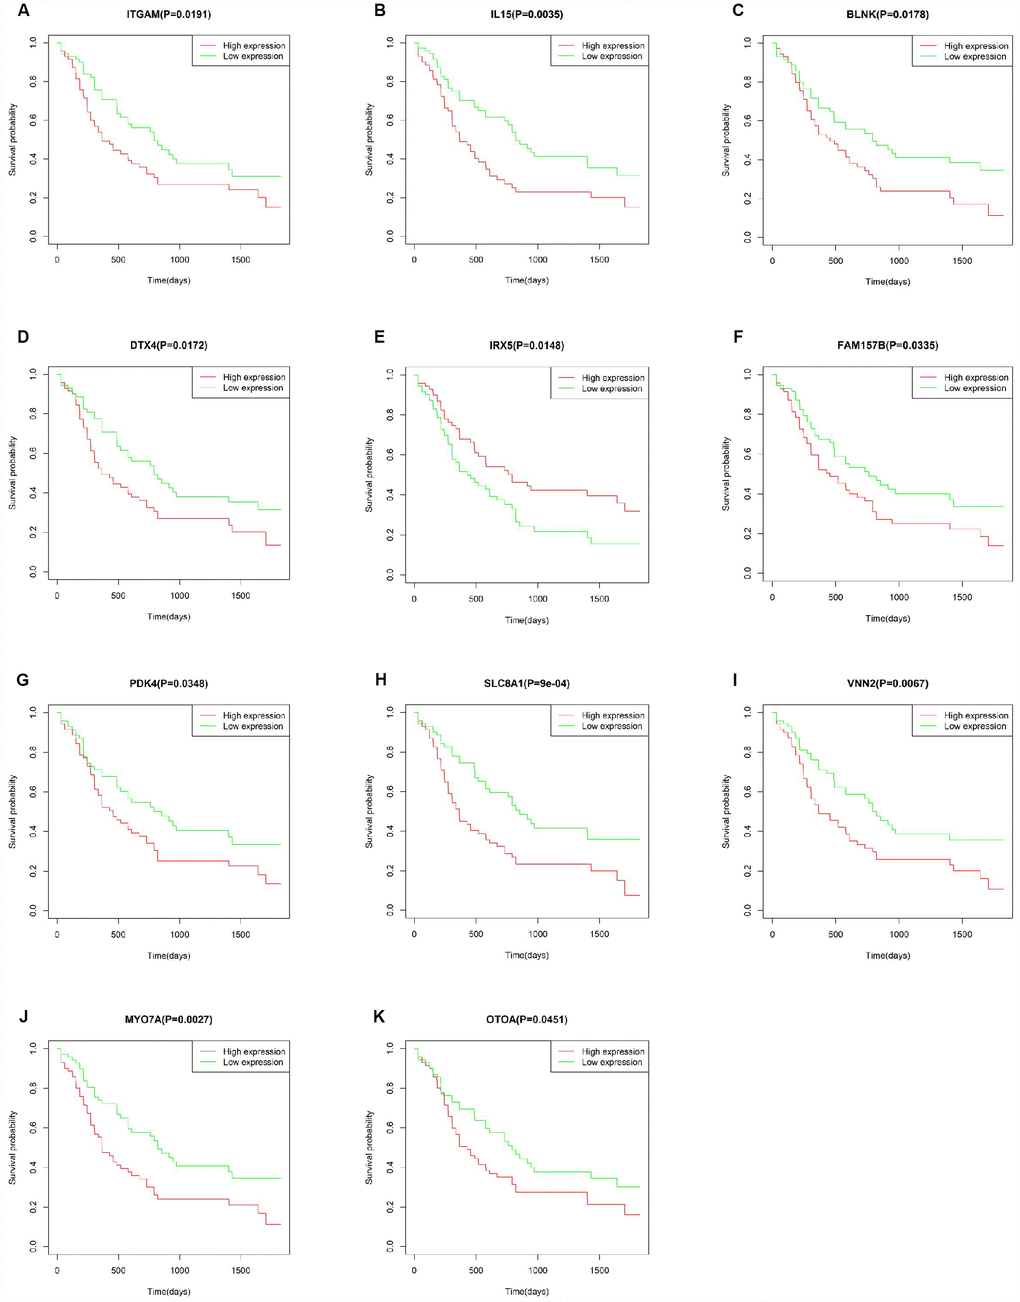
Figure 7.Correlation of the expression of individual DEGs with overall survival of AML patients from TCGA database. (A–K) Kaplan-Meier survival curves for selected DEGs following comparison of high vs. low gene expression groups according to the median value of each gene (log-rank test, p < 0.05).