Submit an Article
Navigate
Home
Editorial Board
Editorial Policies
Current Volume
Archive
Scientific Integrity
Publication Ethics Statements
Interviews with Outstanding Authors
Newsroom
Sponsored Conferences
Podcast
Contact
Special Collections
Submit an Article
Online ISSN: 1945-4589
Research Paper
|
Volume 11, Issue 22
|
pp. 10557–10580
Identification of prognostic genes in the acute myeloid leukemia microenvironment
Back to article
Figure 6
(6 of 10)
−
100%
+
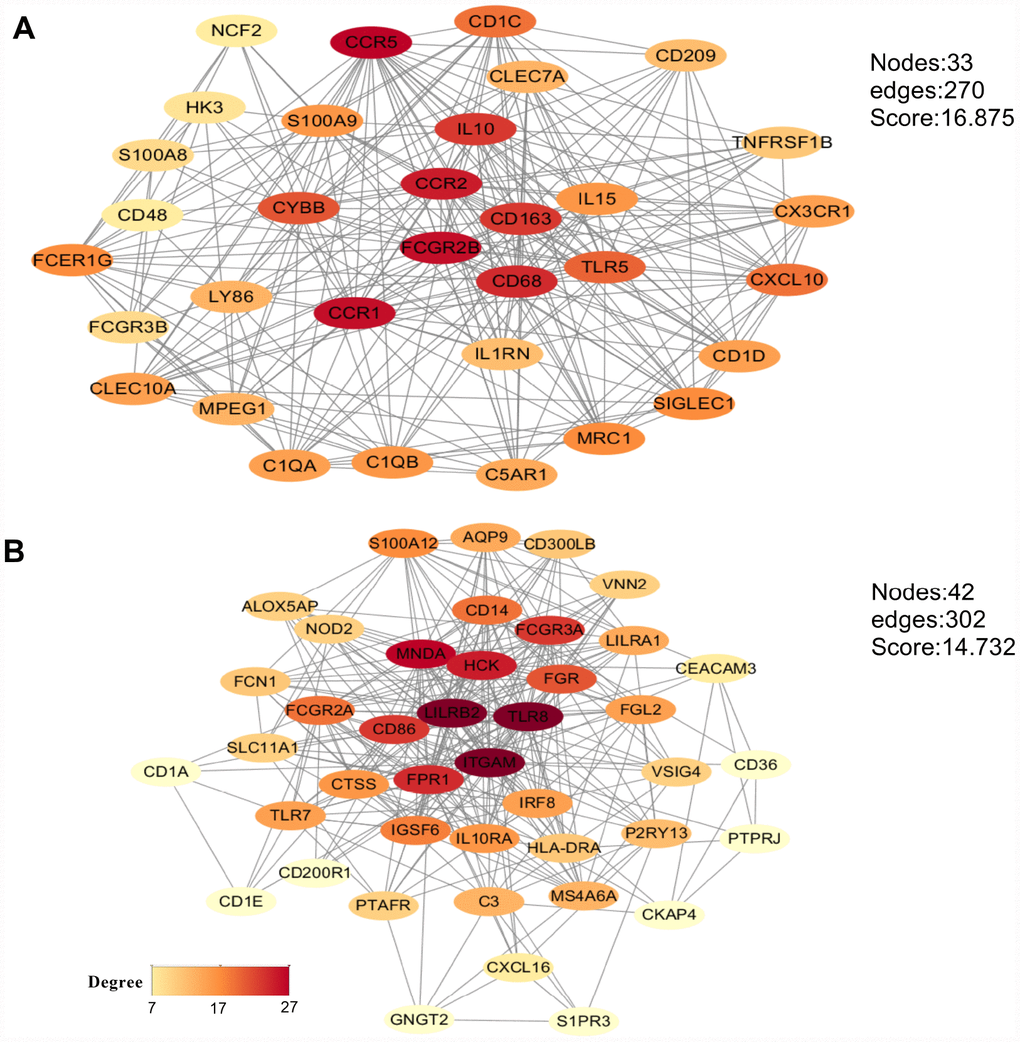
Figure 6.
Main modules identified through protein-protein interaction network analysis.
(
A
) CCR5 module. (
B
) ITGAM module. The color of a node in each module reflects its connectivity degree score.