Submit an Article
Navigate
Home
Editorial Board
Editorial Policies
Current Volume
Archive
Scientific Integrity
Publication Ethics Statements
Interviews with Outstanding Authors
Newsroom
Sponsored Conferences
Podcast
Contact
Special Collections
Submit an Article
Online ISSN: 1945-4589
Research Paper
|
Volume 11, Issue 22
|
pp. 10485–10498
Identification of functional tRNA-derived fragments in senescence-accelerated mouse prone 8 brain
Back to article
Figure 3
(3 of 3)
−
100%
+
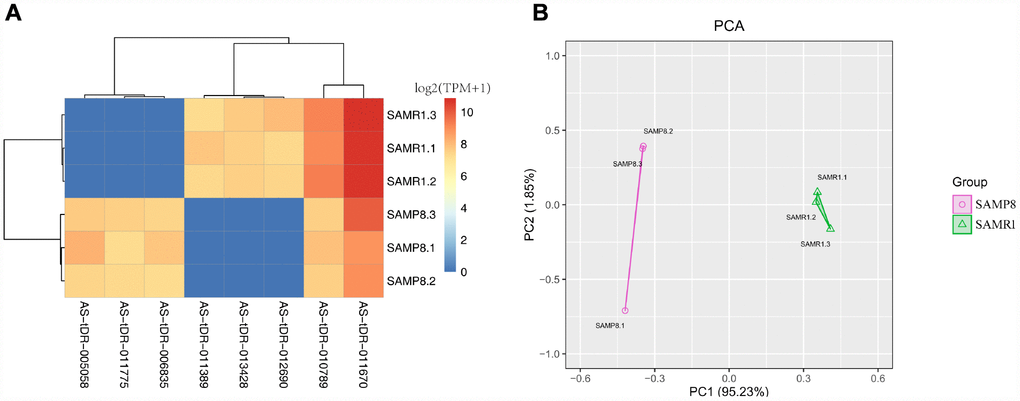
Figure 3.
Cluster analysis and principal component analysis of differentially expressed tRFs in the SAMP8 vs SAMR1 mice.
(
A
) Cluster analysis. (
B
) Principal component analysis.