Submit an Article
Navigate
Home
Editorial Board
Editorial Policies
Current Volume
Archive
Scientific Integrity
Publication Ethics Statements
Interviews with Outstanding Authors
Newsroom
Sponsored Conferences
Podcast
Contact
Special Collections
Submit an Article
Online ISSN: 1945-4589
Research Paper
|
Volume 11, Issue 22
|
pp. 10454–10467
Abnormal gut microbiota composition contributes to the development of type 2 diabetes mellitus in db/db mice
Back to article
Figure 3
(3 of 7)
−
100%
+
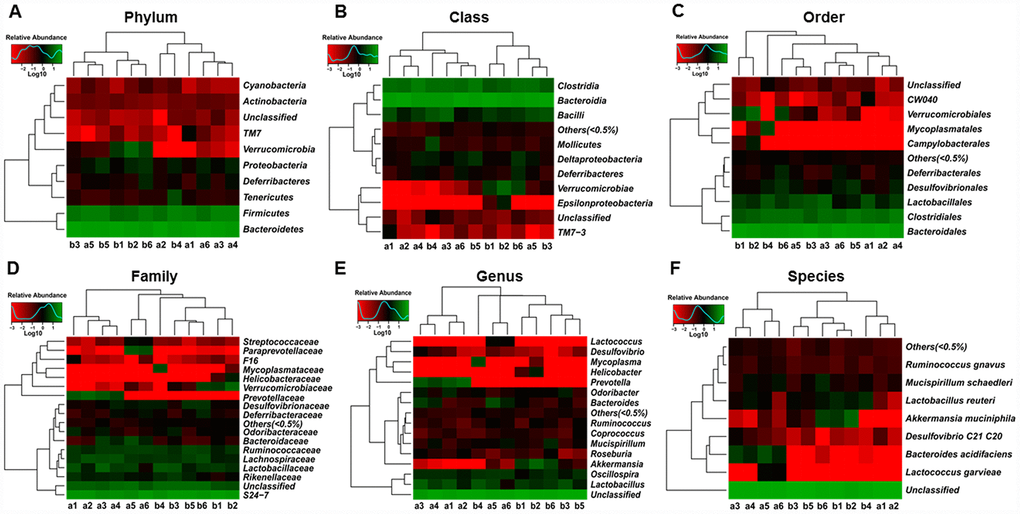
Figure 3.
Heat maps of the composition of the gut microbiota in db/db and m/m mice.
(
A
) Phylum level; (
B
) Class level; (
C
) Order level; (
D
) Family level; (
E
) Genus level; (
F
) Species level.