Submit an Article
Navigate
Home
Editorial Board
Editorial Policies
Current Volume
Archive
Scientific Integrity
Publication Ethics Statements
Interviews with Outstanding Authors
Newsroom
Sponsored Conferences
Podcast
Contact
Special Collections
Submit an Article
Online ISSN: 1945-4589
Research Paper
|
Volume 11, Issue 22
|
pp. 10409–10421
The anti-inflammation, anti-oxidative and anti-fibrosis properties of swertiamarin in cigarette smoke exposure-induced prostate dysfunction in rats
Back to article
Figure 7
(7 of 9)
−
100%
+
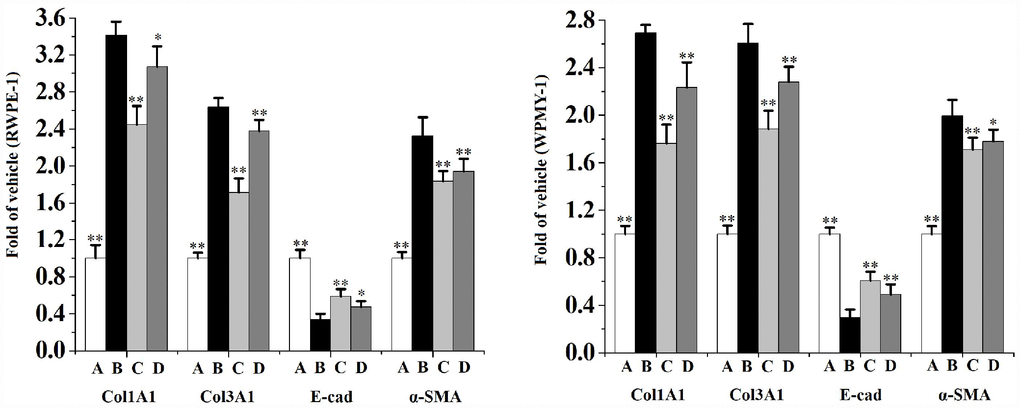
Figure 7.
The mRNA levels of Col1A1, Col3A1, E-cad and α-SMA in RWPE-1 and WPMY-1 cells (n=4 per group).
**
p
<0.01,
*
p
<0.05 compared to 5% CS. A: vehicle, B: 5% CS, C: CS-30 μmol/L swertiamarin, D: CS-15 μmol/L swertiamarin.