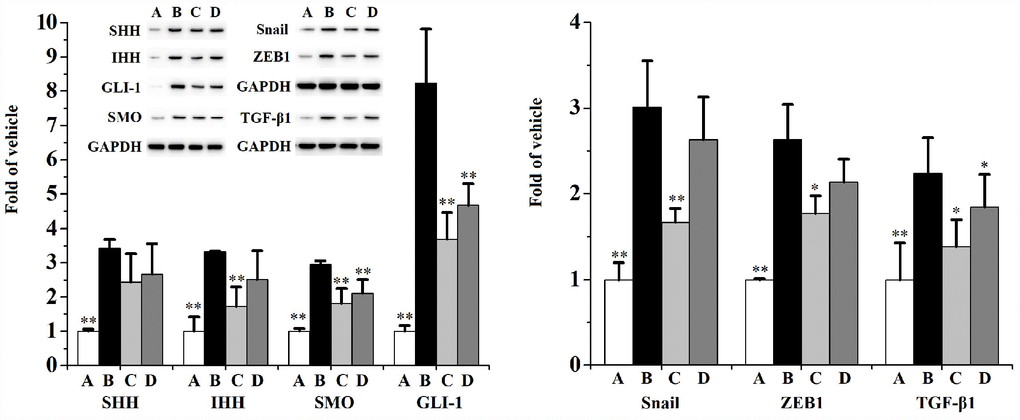
Figure 5.Prostatic expression (n=3 per group) of SHH, IHH, SMO, GLI-1, Snail, ZEB1 and TGF-β1.**p<0.01, *p<0.05 compared to the CS group. A: vehicle, B: CS, C: CS-32 mg/kg swertiamarin, D: CS-16 mg/kg swertiamarin.
Figure 5 — The anti-inflammation, anti-oxidative and anti-fibrosis properties of swertiamarin in cigarette smoke exposure-induced prostate dysfunction in rats | Aging