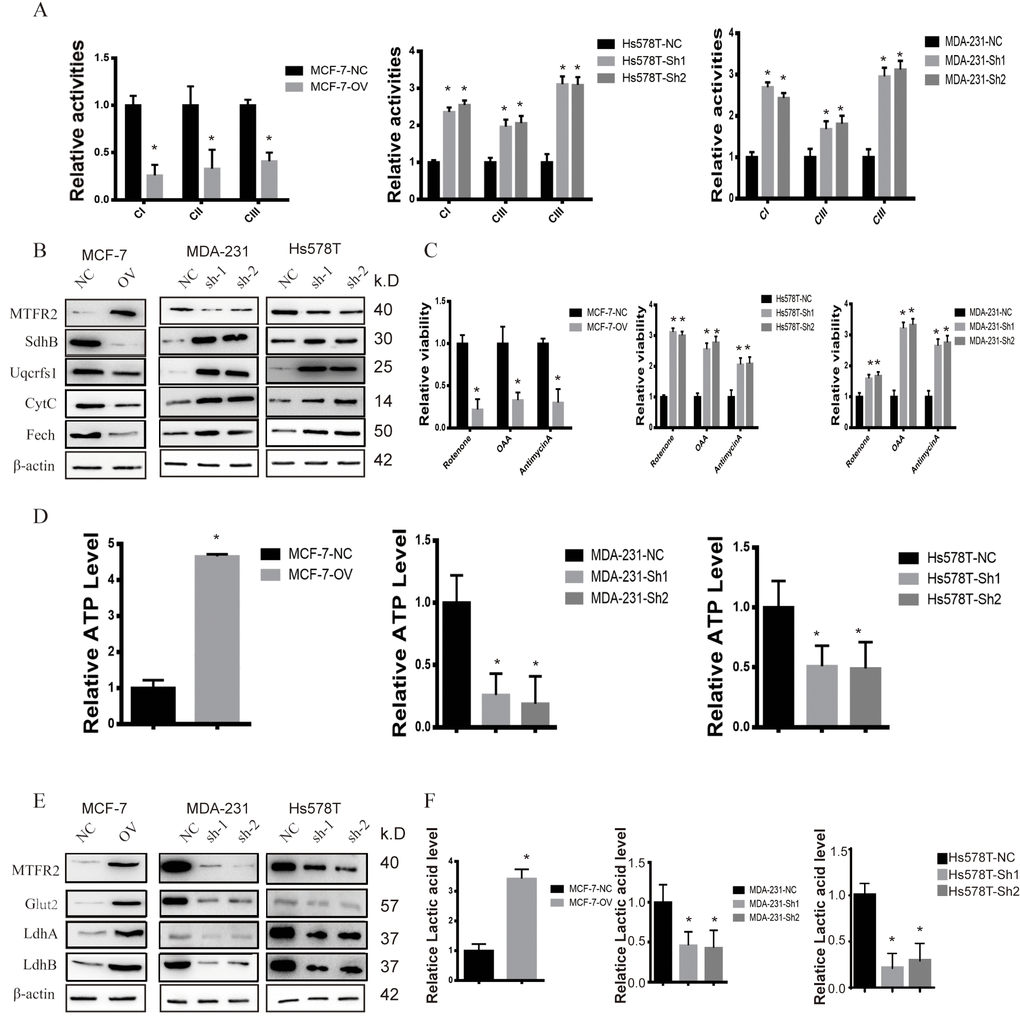
Figure 3.MTFR promotes the glycolysis of BC. (A) The relative activities of the CI CII and CIII of different cell lines (Student’s two one-tailed paired test * p<0.05). (B) Western blot of OXPHOS markers of different cell lines. (C) The relative viability of different cell lines treated with different inhibitors (Student’s two one-tailed paired test * p<0.05). (D) The relative ATP level of different cell lines (Student’s two one-tailed paired test * p<0.05). (E) Western blot of glycolysis markers of different cell lines. (F) The relative lactic acid level of different cell lines (Student’s two one-tailed paired test * p<0.05).