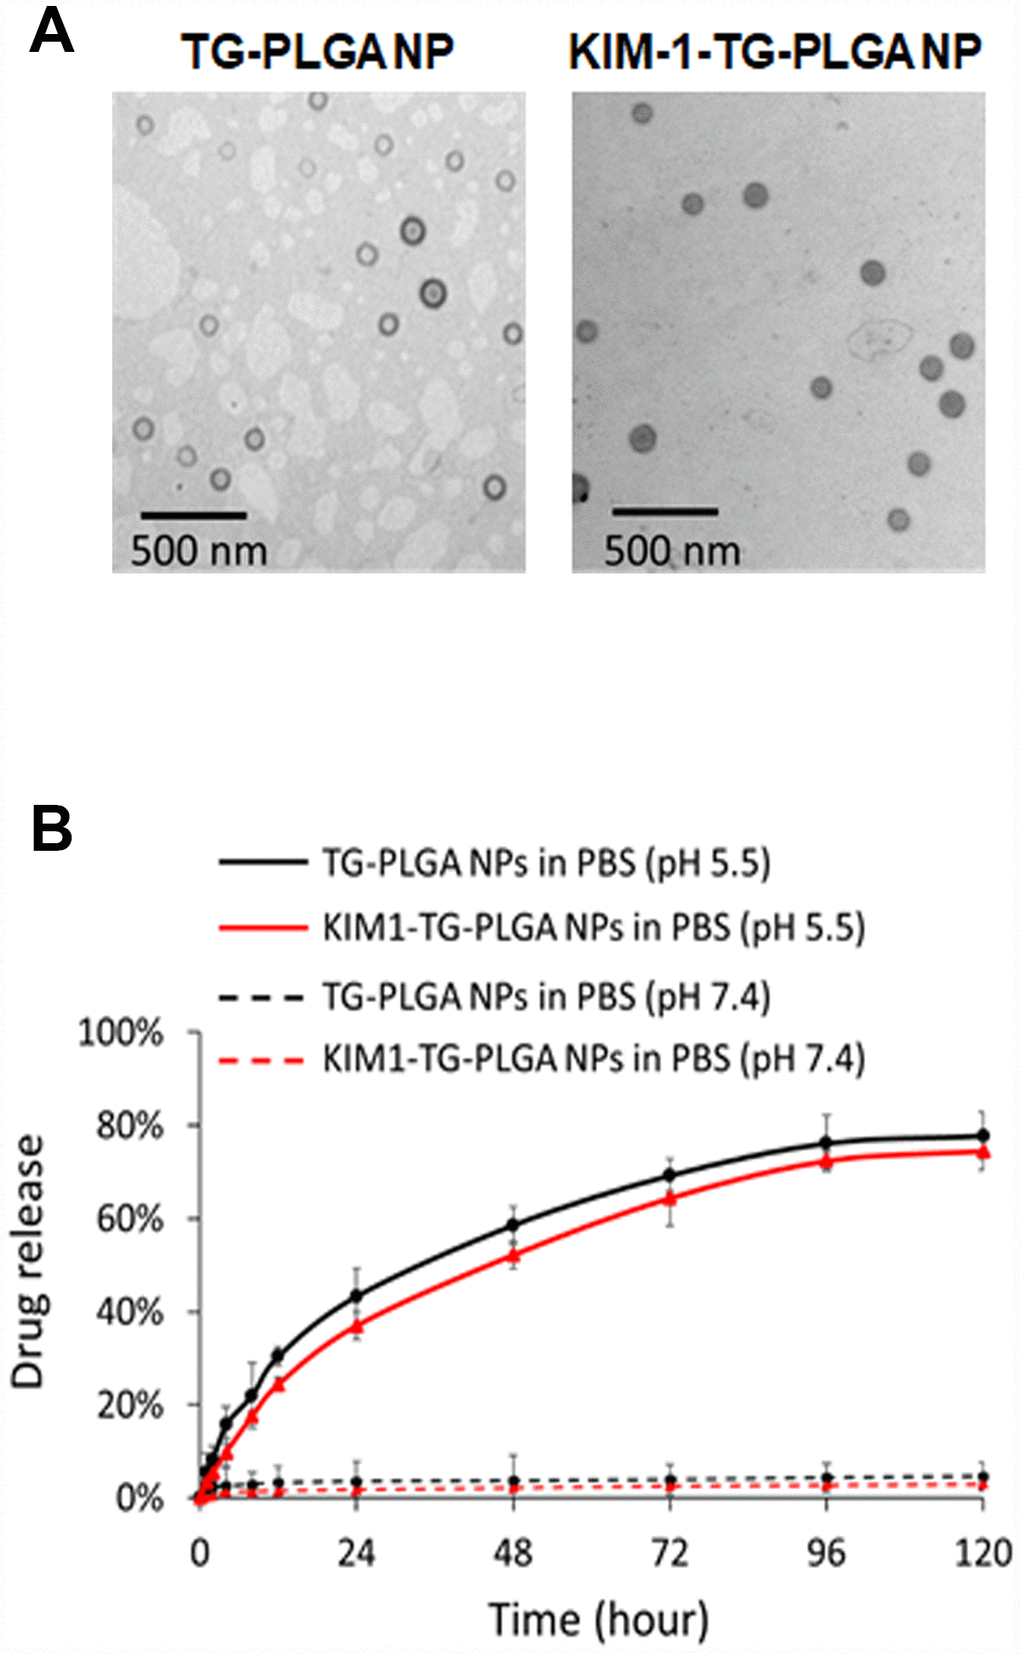
Figure 2.The morphology and TG release profile of TG NPs and KIM-1-TG NPs. (A) TEM images of the TG NPs and KIM-1-TG NPs. (B) In vitro TG release profile of the TG NPs and KIM-1-TG NPs incubated at 37°C in PBS (pH 5.5 and 7.4).
Figure 2 — Promising therapeutic effect of thapsigargin nanoparticles on chronic kidney disease through the activation of Nrf2 and FoxO1 | Aging