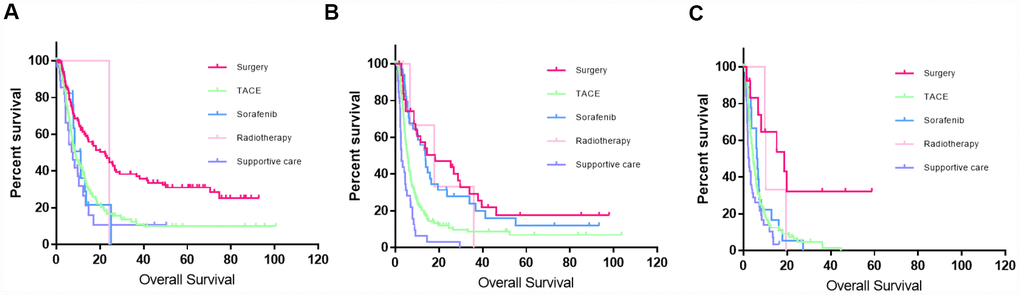
Figure 4.Kaplan–Meier curves of patients who received different treatment in different stages using this new classification system. (A) Kaplan–Meier curve for BCLC-C1; liver resection significantly improved the survival outcomes compared to those of the other treatments (P < 0.001). (B) Kaplan–Meier curve for BCLC-C2; although a small proportion of patients still accepted liver resection, the survival benefit was not significant compared to that of those who received sorafenib or radiotherapy (P > 0.5). (C) Kaplan–Meier curve in BCLC-C3; less than 5% of the patients were eligible for liver resection.