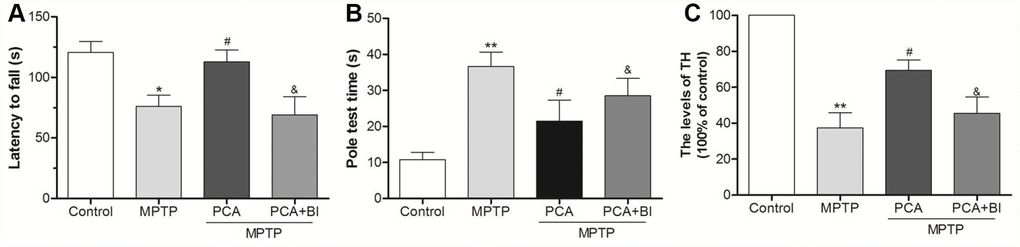
Figure 9.BI2536 (BI) reversed the neuroprotection effect of PCA. (A) Rotarod test in control, MPTP, PCA+MPTP and PCA+MPTP+BI group. (B) Pole test in each group. (C) TH levels from SN tissues were measured by ELISA. Data were expressed as mean ± S.D., n=6; *P< 0.05, **P< 0.01 vs. control group; #P< 0.05 vs. MPTP group, &P< 0.05 vs. PCA+MPTP group.