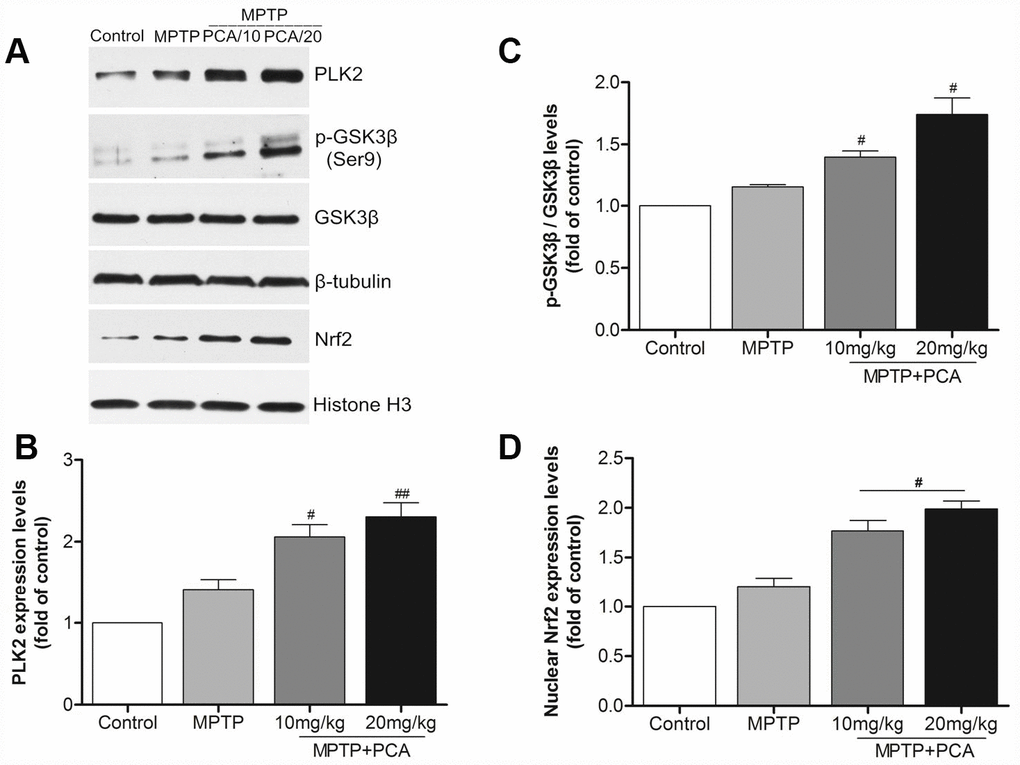
Figure 4.PCA raised the expression levels of PLK2, p-GSK3β and nuclear Nrf2 in midbrain. (A) Representative western blot bands of PLK2, p-GSK3β, GSK3β, Nrf2, tubulin and Histone H3 in each group. (B–D) Quantification of PLK2, p-GSK3β/GSK3β and nuclear Nrf2 levels in midbrain tissues. Data were expressed as mean ± S.D., n = 6; *P< 0.01 vs. control group, #P< 0.05 vs. MPTP group.