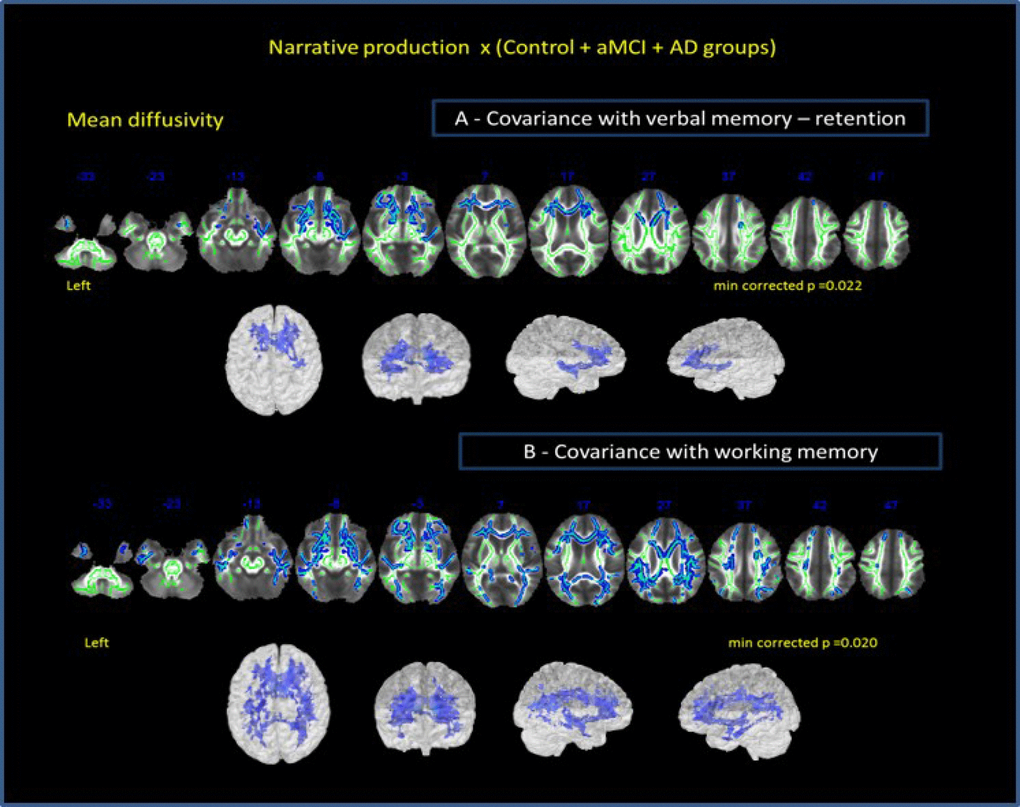
Figure 4.Correlation of all groups performance in narrative discourse and whole-brain analysis. (A) -verbal memory (results of RAVLT test – retention A7-A5) and (B) working memory (results of auditory digit span backward) as covariates. Cluster of voxels significantly different in MD value is shown in blue.