Submit an Article
Navigate
Home
Editorial Board
Editorial Policies
Current Volume
Archive
Scientific Integrity
Publication Ethics Statements
Interviews with Outstanding Authors
Newsroom
Sponsored Conferences
Podcast
Contact
Special Collections
Submit an Article
Online ISSN: 1945-4589
Research Paper
|
Volume 11, Issue 20
|
pp. 9188–9208
Narrative impairment, white matter damage and CSF biomarkers in the Alzheimer’s disease spectrum
Back to article
Figure 2
(2 of 5)
−
100%
+
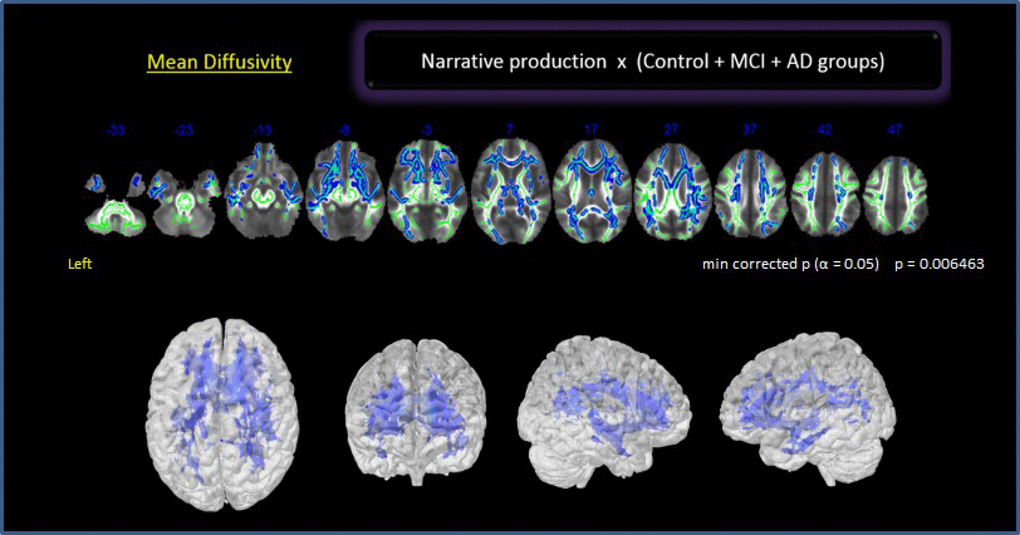
Figure 2.
Correlation between NProd and whole brain for all groups. Clusters of voxels significantly different MD shown in blue.