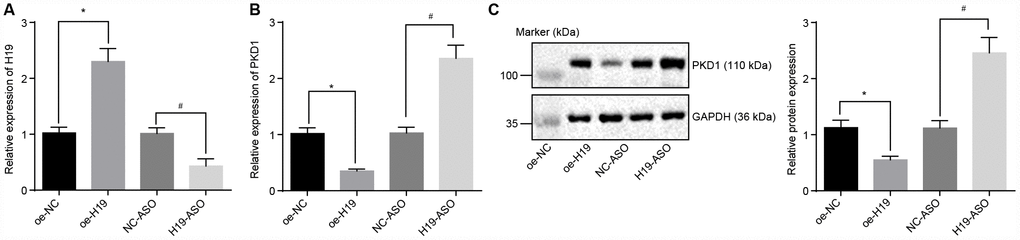
Figure 3.The level of PKD1 is elevated by silencing of H19. (A) The silencing or overexpressing efficiency of H19 assessed by RT-qPCR. (B) The transcriptional level of PKD1 after silencing or overexpressing H19 in atherosclerotic tissues determined by RT-qPCR. (C) The protein level of PKD1 after silencing or overexpressing H19 in atherosclerotic tissues normalized to GAPDH evaluated by Western blot analysis (the unprocessed blots are shown in Supplementary Figure 1). * p < 0.05 vs. the oe-NC group; # p < 0.05 vs. the NC-ASO group. The data were measurement data and expressed by mean ± standard deviation. Data differences between two groups were analyzed by unpaired t-test. n = 6. The experiment was repeated three times independently.