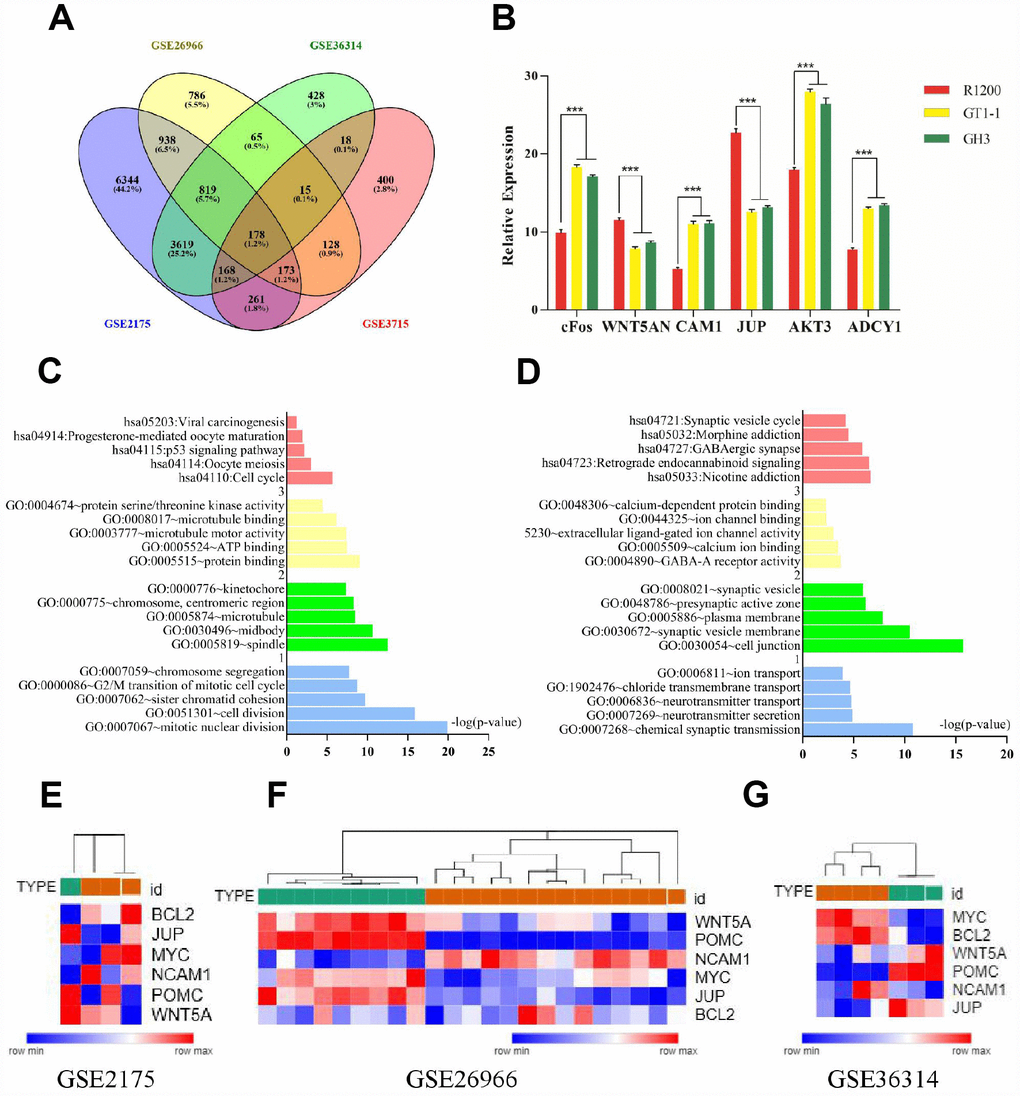
Figure 1.(A) Venn diagrams for DEGs. (B) Results of q-PCR analysis. (C) Functional and pathway enrichment analysis of up- regulated genes. (B) Expression heat map of hub genes. (D) Functional and pathway enrichment analysis of down-regulated genes. (E–G) Expression heat map of hub genes.