Submit an Article
Navigate
Home
Editorial Board
Editorial Policies
Current Volume
Archive
Scientific Integrity
Publication Ethics Statements
Interviews with Outstanding Authors
Newsroom
Sponsored Conferences
Podcast
Contact
Special Collections
Submit an Article
Online ISSN: 1945-4589
Research Paper
|
Volume 11, Issue 22
|
pp. 10000–10015
Mapping the patterns of cortical thickness in single- and multiple-domain amnestic mild cognitive impairment patients: a pilot study
Back to article
Figure 5
(5 of 5)
−
100%
+
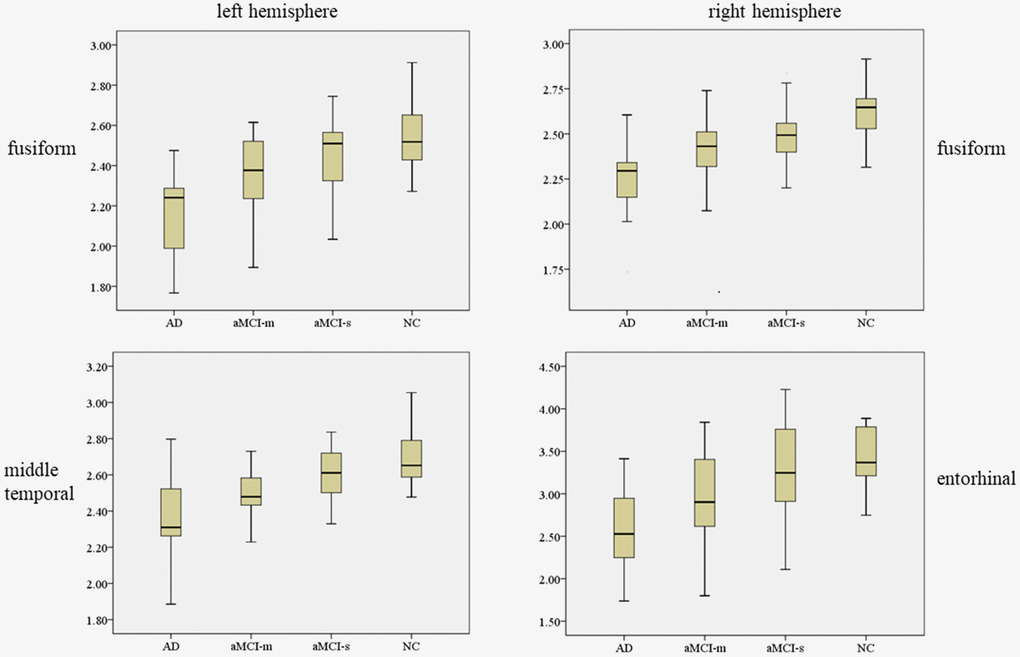
Figure 5.
The mean ± standard deviation values for the cortical thickness in left hemisphere fusiform, middle temporal and right hemisphere fusiform, entorhinal.