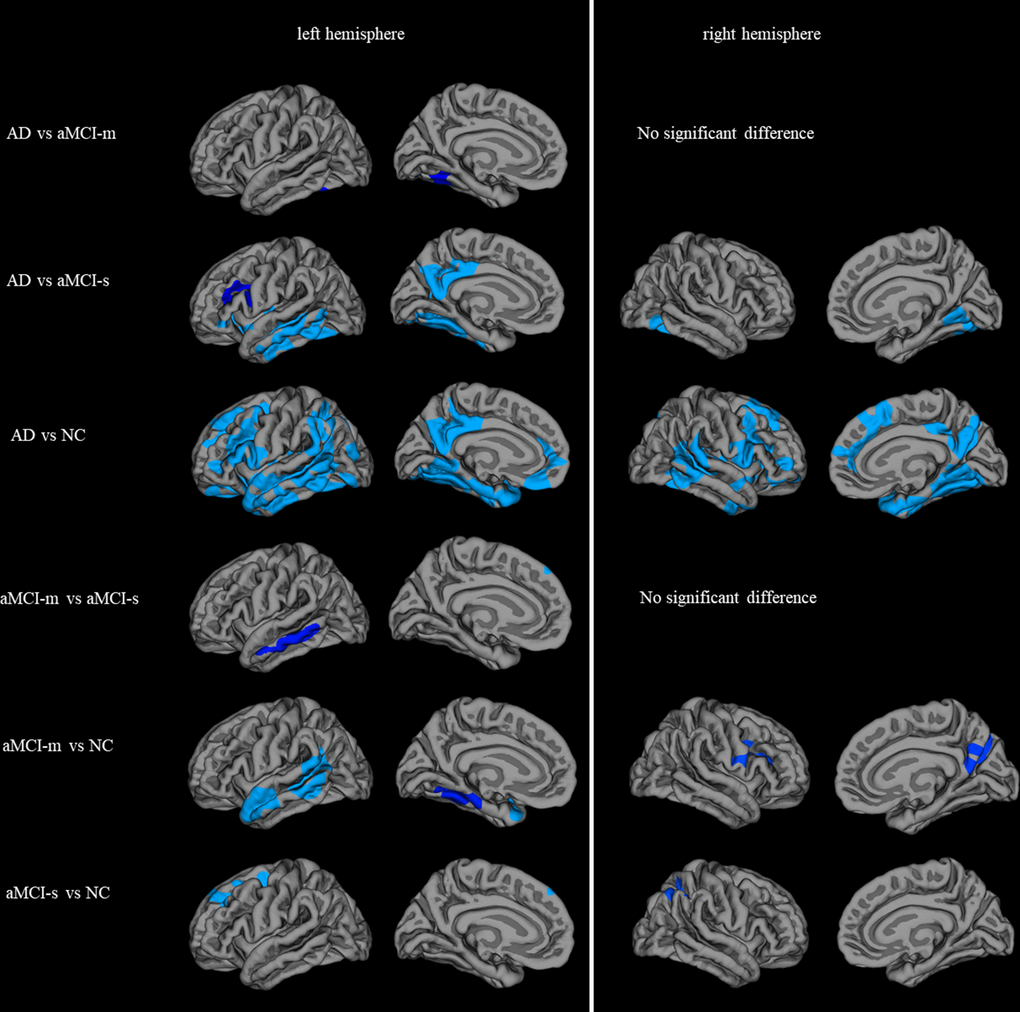
Figure 4.Statistically significant brain regions obtained by group comparisons between the AD, aMCI-m, aMCI-s and NC groups (Monte Carlo simulation corrected for multiple comparisons). The significance was -log(p) instead of straight p value for display purpose.