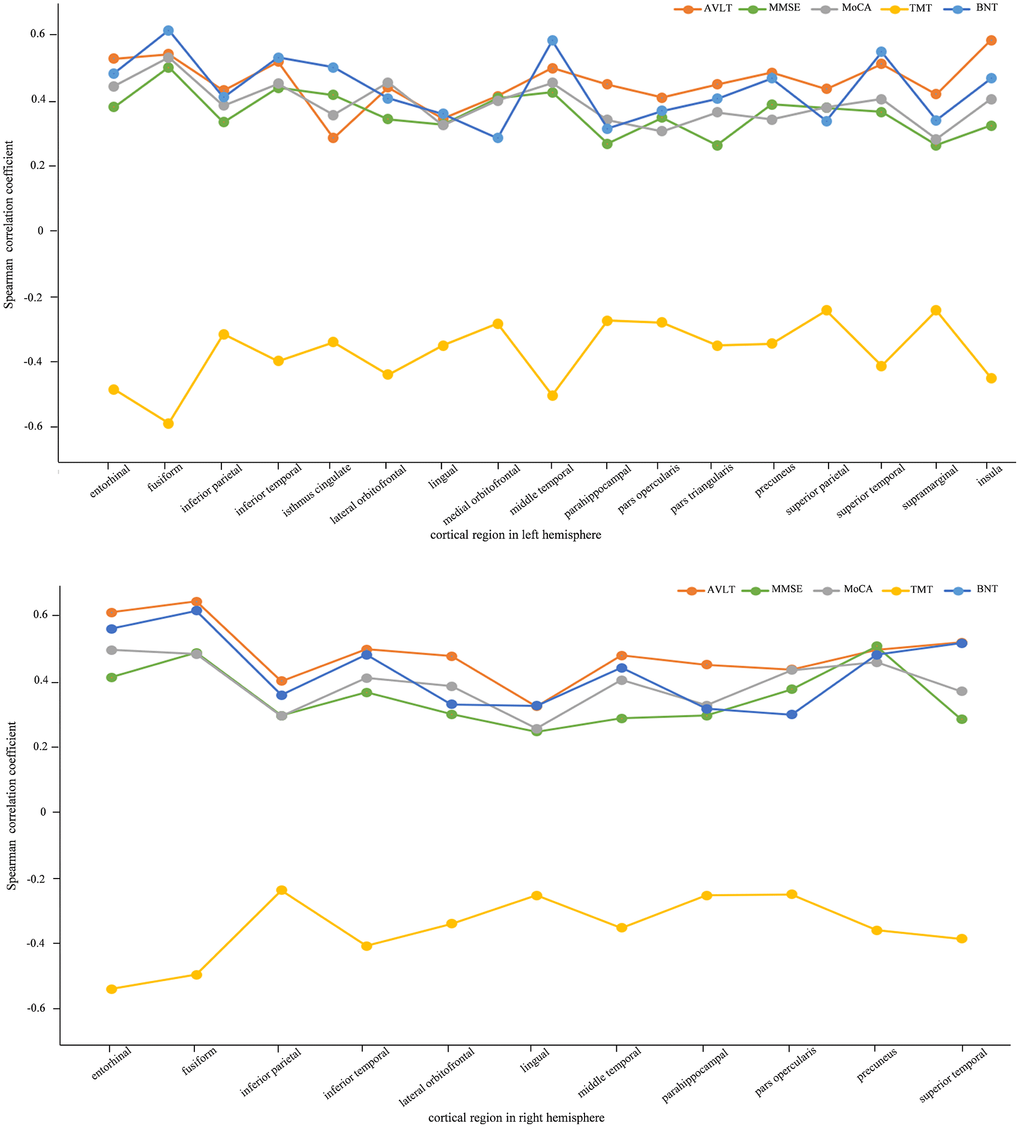
Figure 2.Spearman correlation between cortical thickness and neuropsychological measurements for AD, aMCI-m, aMCI-s and NC groups. The figures list the high correlation cortical regions with corresponding neuropsychological measurements (p < 0.05). The above one is left hemisphere and the below one is right hemisphere.