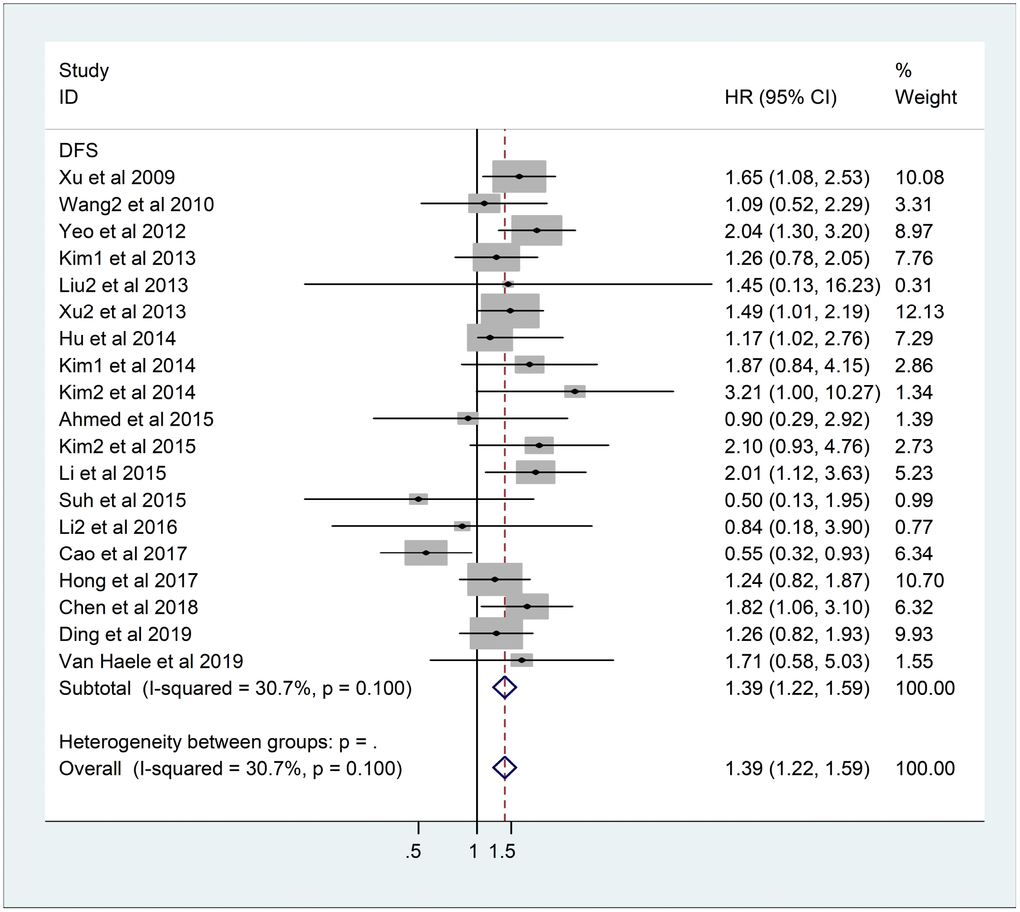
Figure 3.Forest plot of HR for association between YAP1 overexpression and DFS. Note: Weights are from fixed-effects analysis. Abbreviations: CI confidence interval; DFS disease-free survival; HR hazard ratio.
Figure 3 — The prognostic value of YAP1 on clinical outcomes in human cancers | Aging