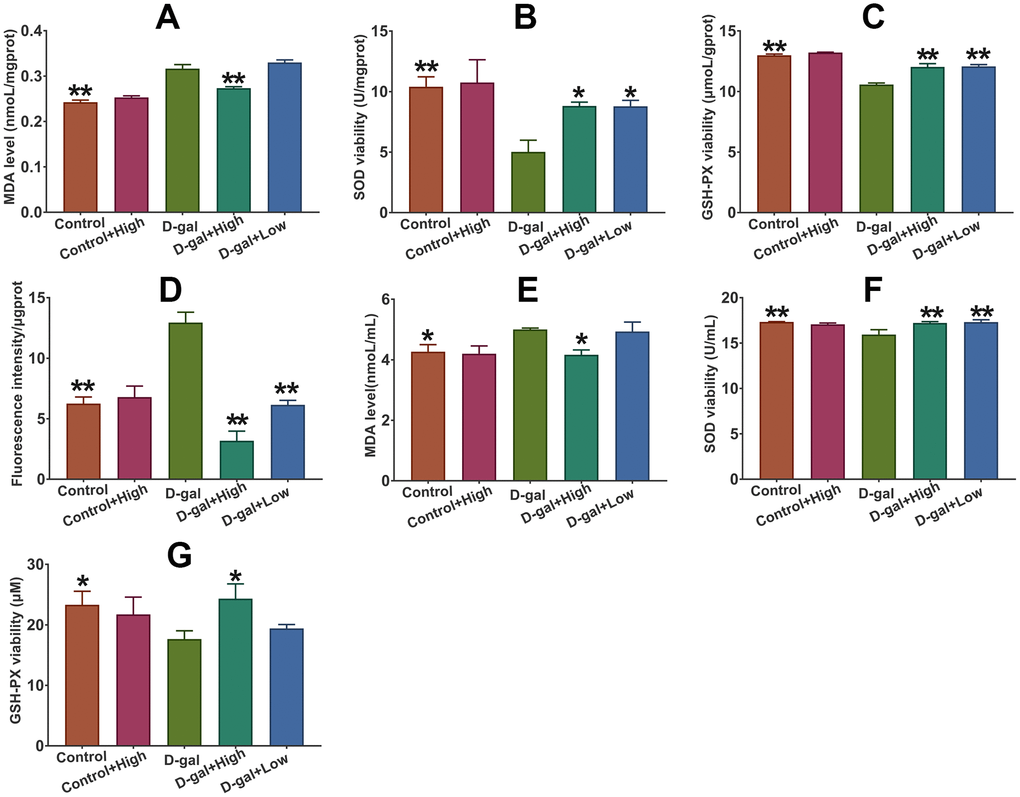
Figure 4.Effect of Prob on ROS and MDA level, and the activities of SOD and GSH-PX. (A–C) MDA level and the activities of SOD and GSH-PX in plasma, respectively. (D–G) Level of ROS and MDA, and the activities of SOD and GSH-PX in plasma, respectively. Data in each experiment represent mean ± SEM from 10 independent samples. Statistically significant differences were calculated by one-way ANOVA using the SPSS 20.0 software. *P<0.05 and ** P<0.01, versus D-gal group.