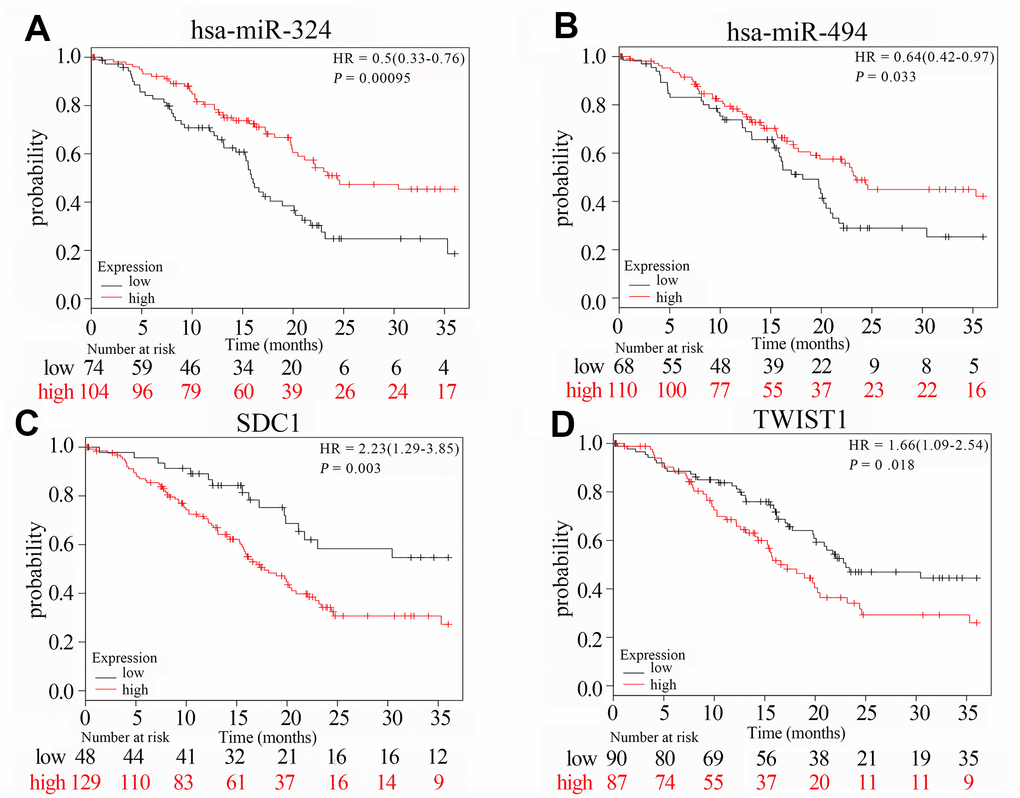
Figure 8.The survival curves of hub genes and their related miRNAs based on Kaplan Meier. (A–D) Transcription levels of hsa-miR-324, hsa-miR-494, SDC1 and TWIST1 are significantly related to the overall survival of patients with PAAD (P < 0.05). Red curve indicates high expression in PAAD tumor tissues; black curve indicates low expression in PAAD tumor tissues; P value < 0.05 indicates statistical significance; HR: hazard ratio.