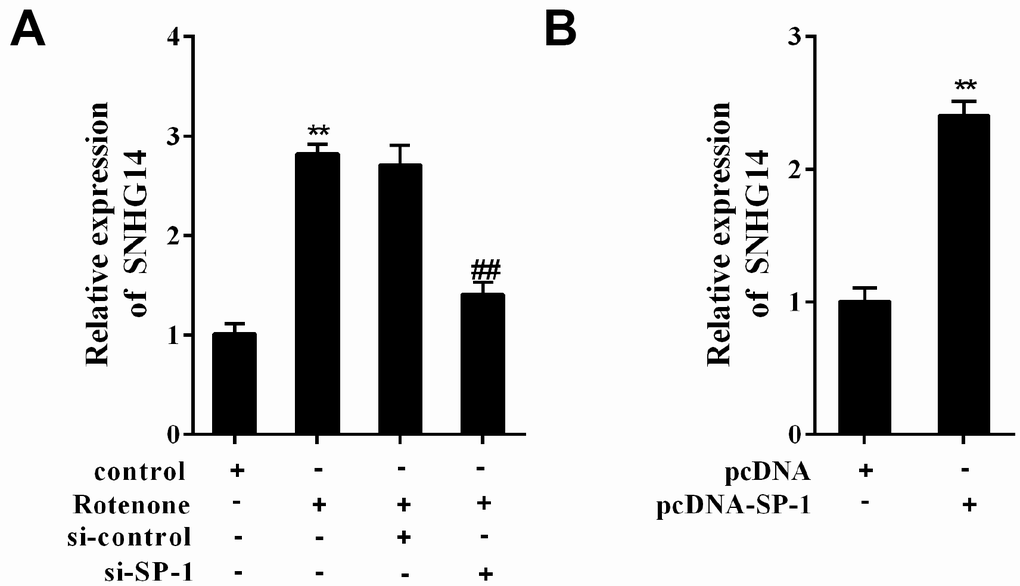
Figure 3.SP-1 affected SNHG14 expression in rotenone-treated or -untreated MN9D cells. MN9D cells were allocated into 4 groups: control, Rotenone (Ro, 1μmol/L), Ro+si-control, and Ro+si-SP-1, or allocated into 2 groups: pcDNA, pcDNA-SP-1. (A and B) Relative expression of SNHG14 was measured using qRT-PCR. **P<0.01 compared with control or pcDNA; ##P<0.01 compared with Ro+si-control.