Submit an Article
Navigate
Home
Editorial Board
Editorial Policies
Current Volume
Archive
Scientific Integrity
Publication Ethics Statements
Interviews with Outstanding Authors
Newsroom
Sponsored Conferences
Podcast
Contact
Special Collections
Submit an Article
Online ISSN: 1945-4589
Research Paper
|
Volume 11, Issue 19
|
pp. 8313–8328
LncRNAs down-regulate Myh1, Casr, and Mis18a expression in the Substantia Nigra of aged male rats
Back to article
Figure 1
(1 of 7)
−
100%
+
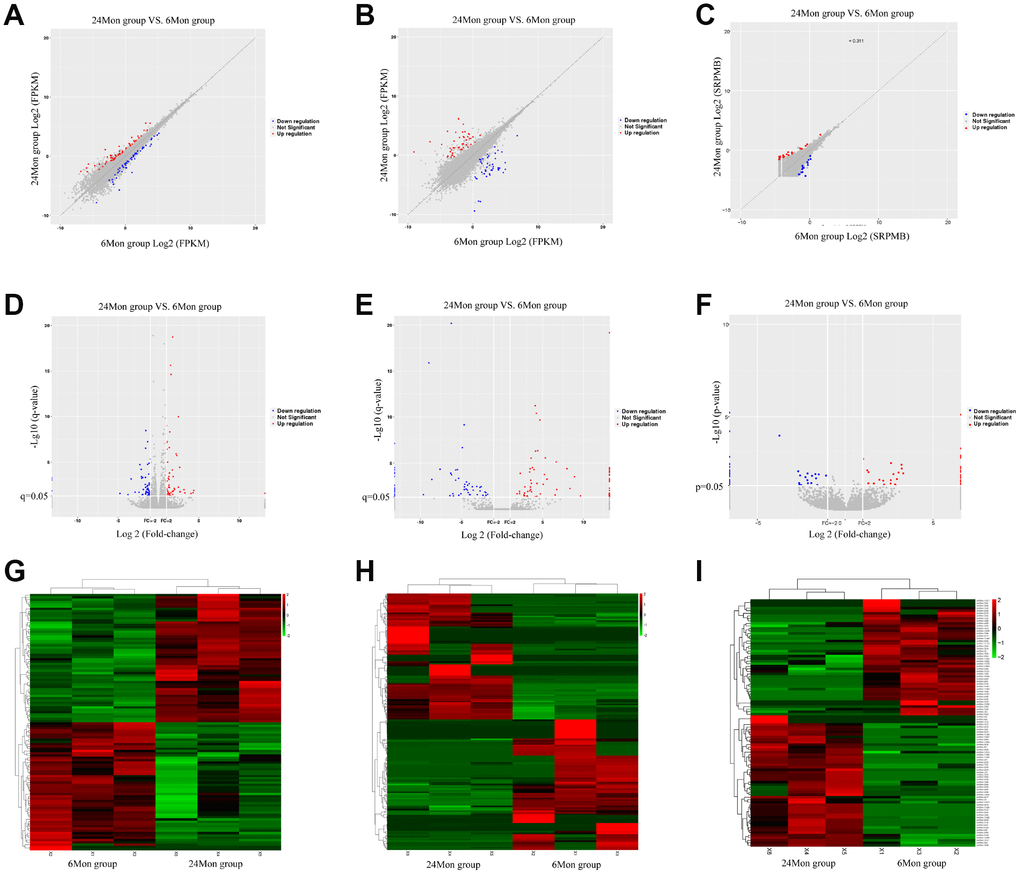
Figure 1.
Scatter diagrams (
A
–
C
), volcano diagrams (
D
–
F
), and hierarchical clustering analysis (
G
–
I
) of relative mRNA (
A
,
D
,
G
), lncRNA (
B
,
E
,
H
), and circRNA (
C
,
F
,
I
) expression signals in the SN of 6Mon and 24Mon rats.