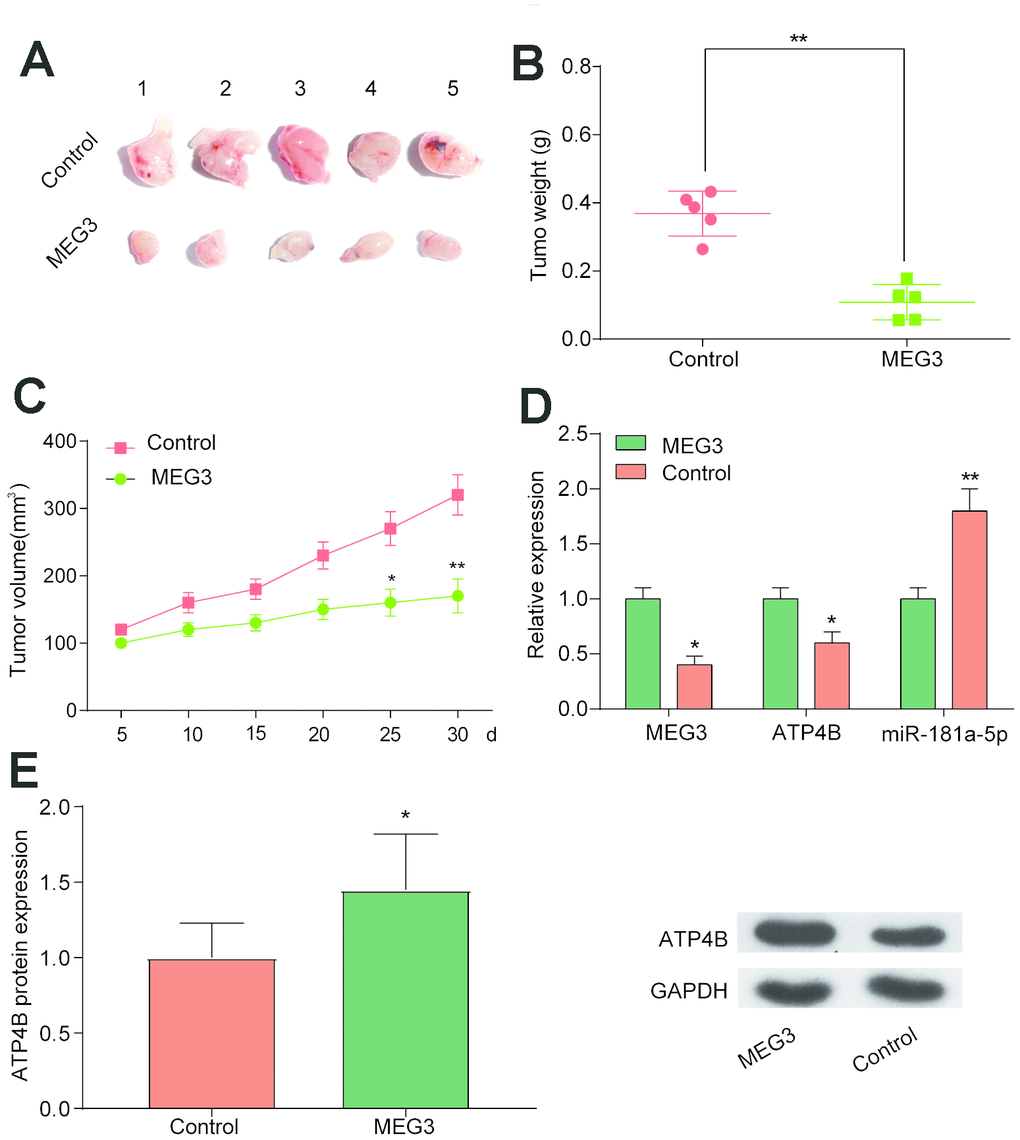
Figure 5.Overexpression of MEG3 in vivo inhibits tumor growth. (A–C) Tumor xenograft results showed that tumor weight and volume were decreased in the MEG3 group compared with the Con group. *P<0.05, **P<0.01, compared with Con group. (D) QRT-PCR results illustrated that ATP4B expression decreased while miR-181a-5p expression increased in the MEG3 group compared with the Con group. (E) Western blotting results illustrated that ATP4B expression increased in the MEG3 group compared with the Con group. *P<0.05, **P<0.01, compared with Con group.