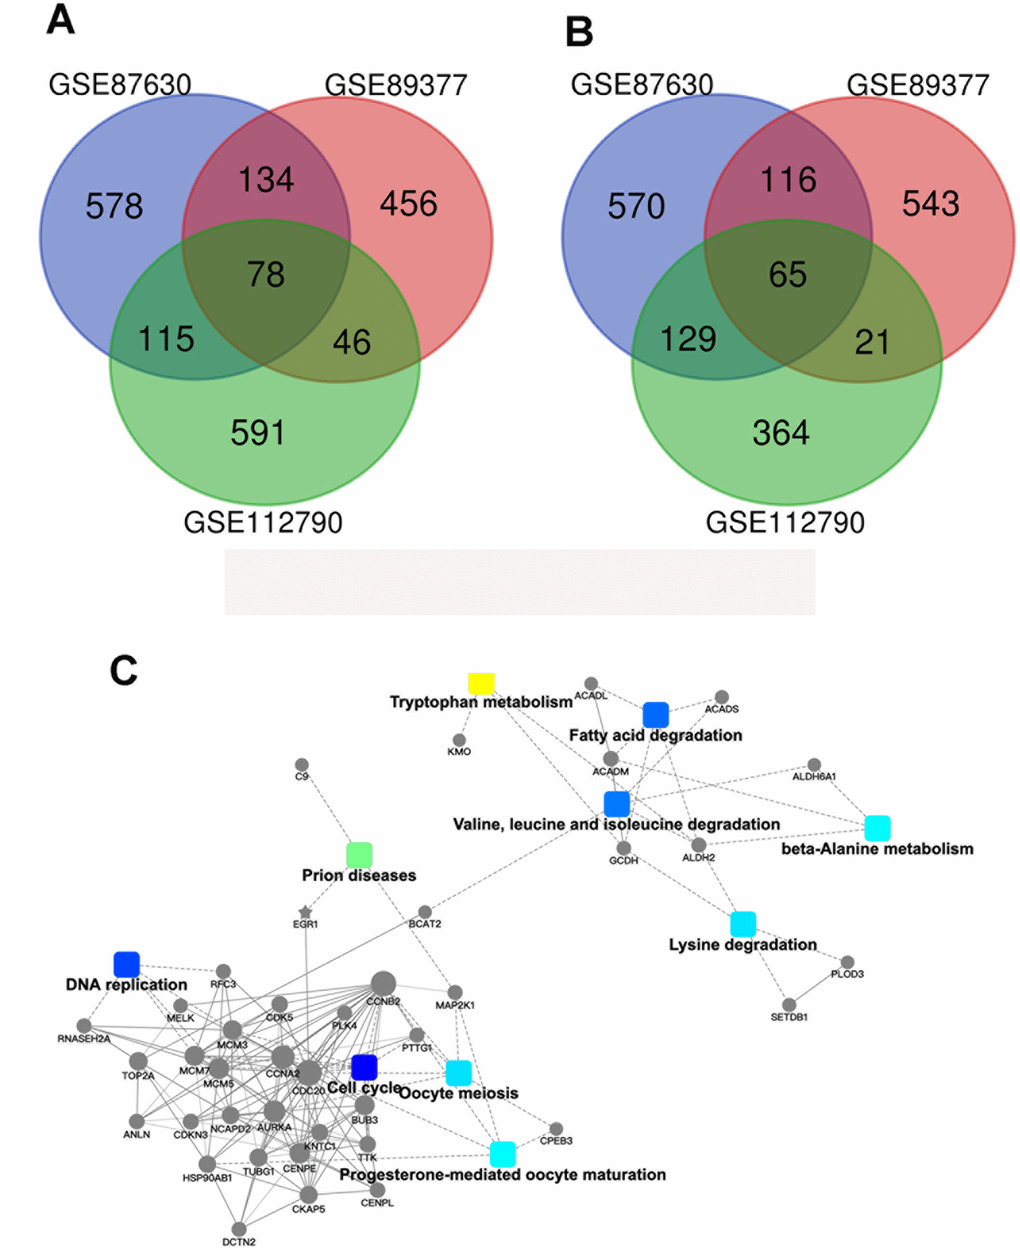
Figure 1.Identification of the genes which show differential expression patterns in HCC. (A) A Venn diagram of the common DEGs associated with GSE87630, GSE89377, and GSE112790. (B) Protein–protein interaction networks which are associated with the differentially expressed genes.