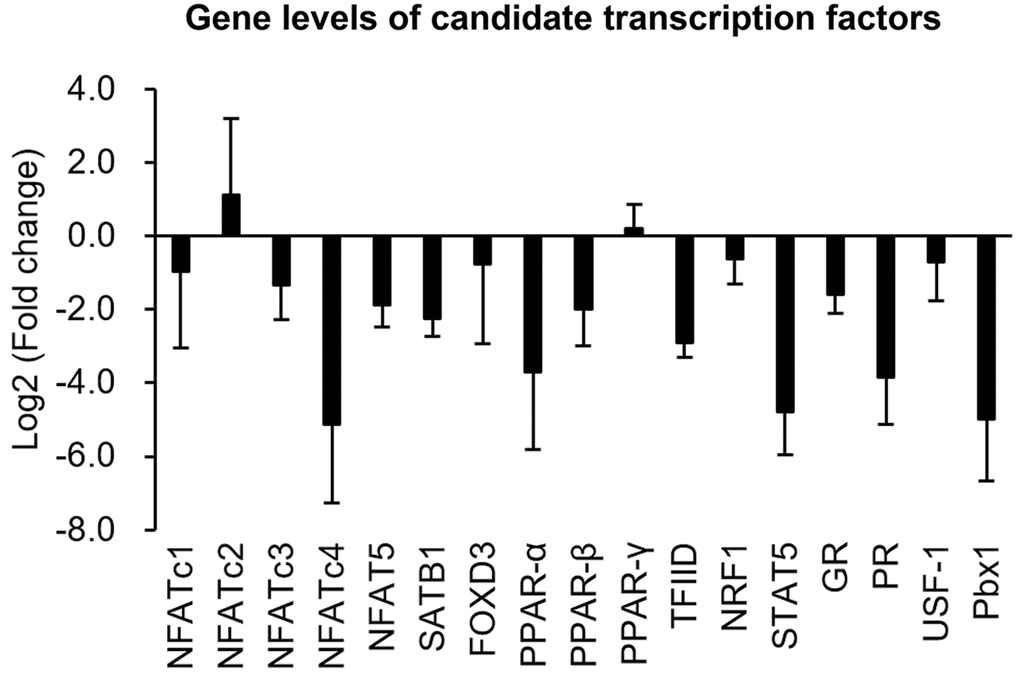
Figure 6.Quantifications of gene levels of candidate transcription factors. Transcriptional expressions of candidate transcription factors in normal and senescent cells were analyzed by a real-time PCR. Gene expression is shown as the log2 (multiple of change) of the transcription factors after senescence induction.