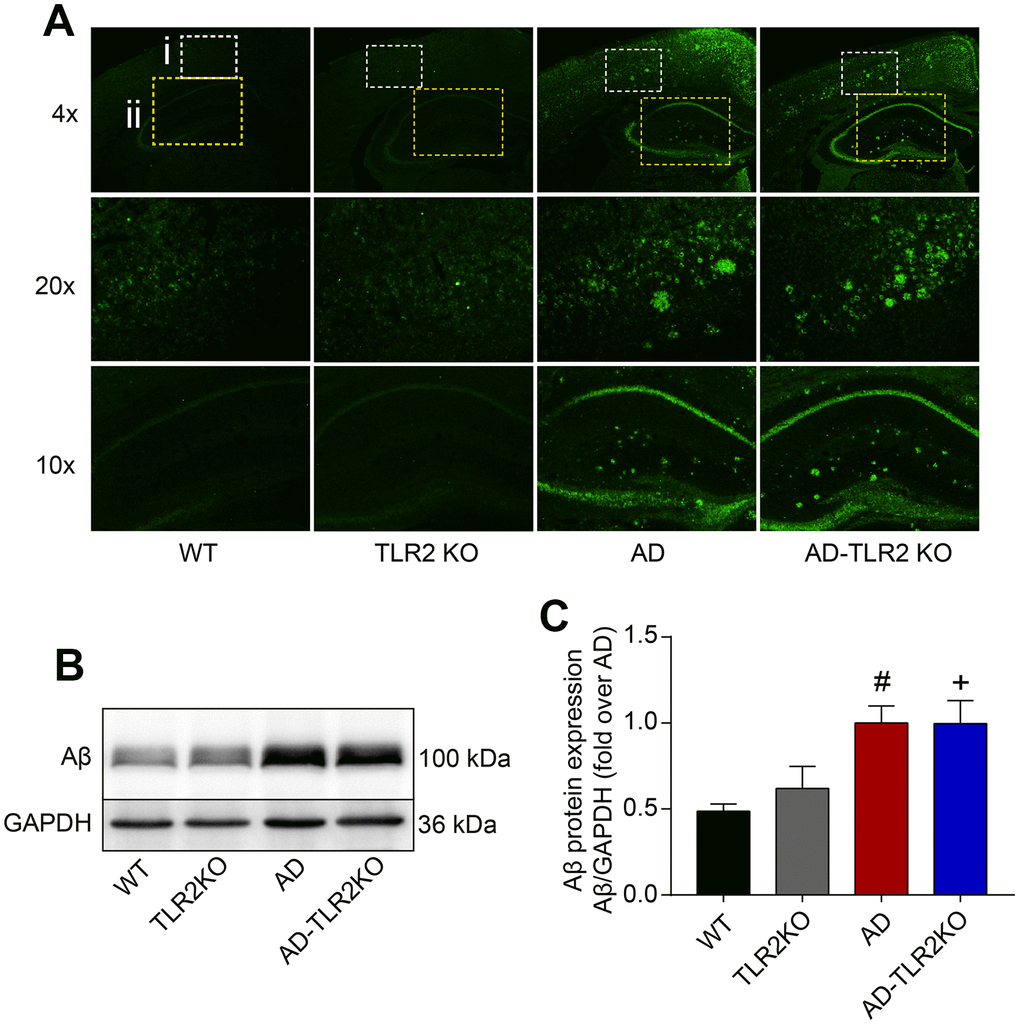
Figure 3.Aβ deposition in mouse brains. (A) Representative immunofluorescence images of Aβ deposition in mouse brains (4x, 20x: cortex; 10x: hippocampus). (B) Representative Aβ levels in brain tissues detected by Western blots. (C) Results from quantitative analyses of Western blots showed that Aβ levels were significantly higher in AD and AD-TLR2KO mice compared with WT and TLR2KO mice, respectively (#: AD vs. WT, p<0.05; +: AD-TLR2KO vs. WT, p<0.05). However, there was no significant difference in Aβ levels between AD and AD-TLR2KO mice (n=6 / group).