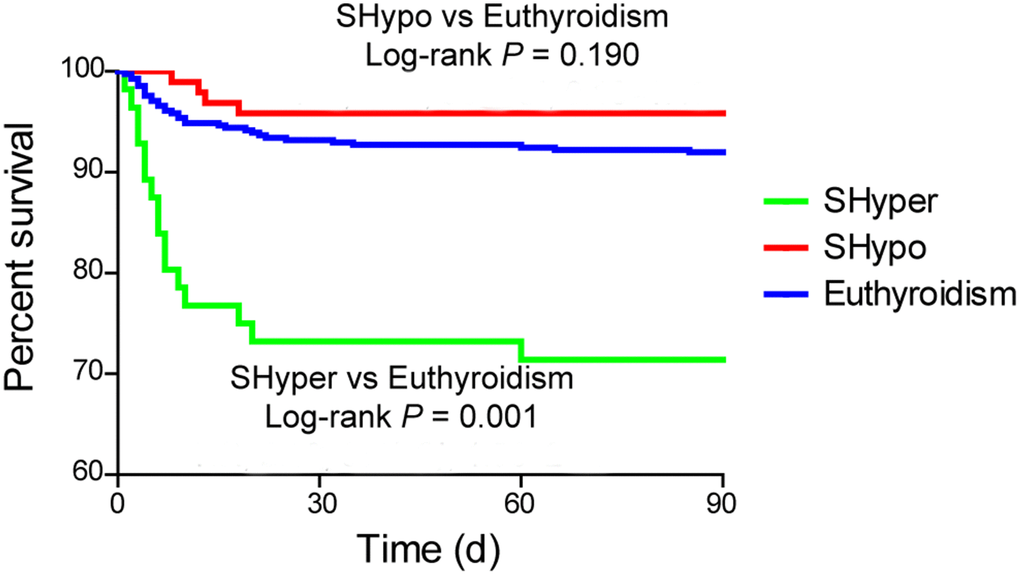
Figure 2.The Kaplan Meier curve for the cumulative 3-month survival rates according to the thyroid status. Log-rank test shows significant difference between patients with SHyper and euthyroidism.
Figure 2 — Prognostic value of subclinical thyroid dysfunction in ischemic stroke patients treated with intravenous thrombolysis | Aging