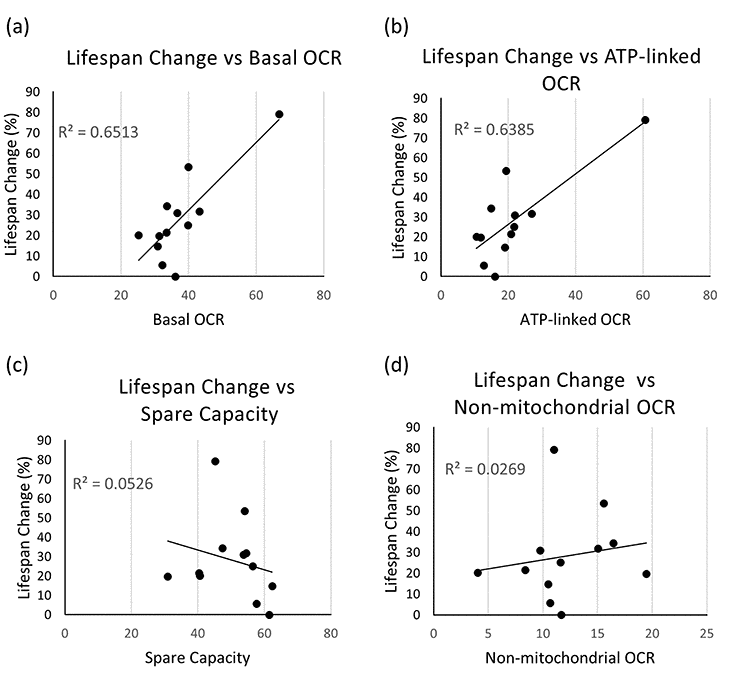
Figure 2.Correlation between mitochondrial respiration and healthspan parameters. (a-d) Correlation plots are shown between % increase in mean lifespan and basal OCR (a), ATP-linked OCR (b), spare capacity or SRC (c), and non-mitochondrial OCR (d). Each dot indicates an average value obtained from independent experiments with variable populations for each condition. For lifespan experiments, an average of 60 animals per condition per replica was used (in two to four independent replicates), while for Seahorse experiments an average of 1500 animals per condition per replica was assessed (at least 4 independent replicates per clone were carried out). Refer to Supplementary Table SI for data used to generate these panels.