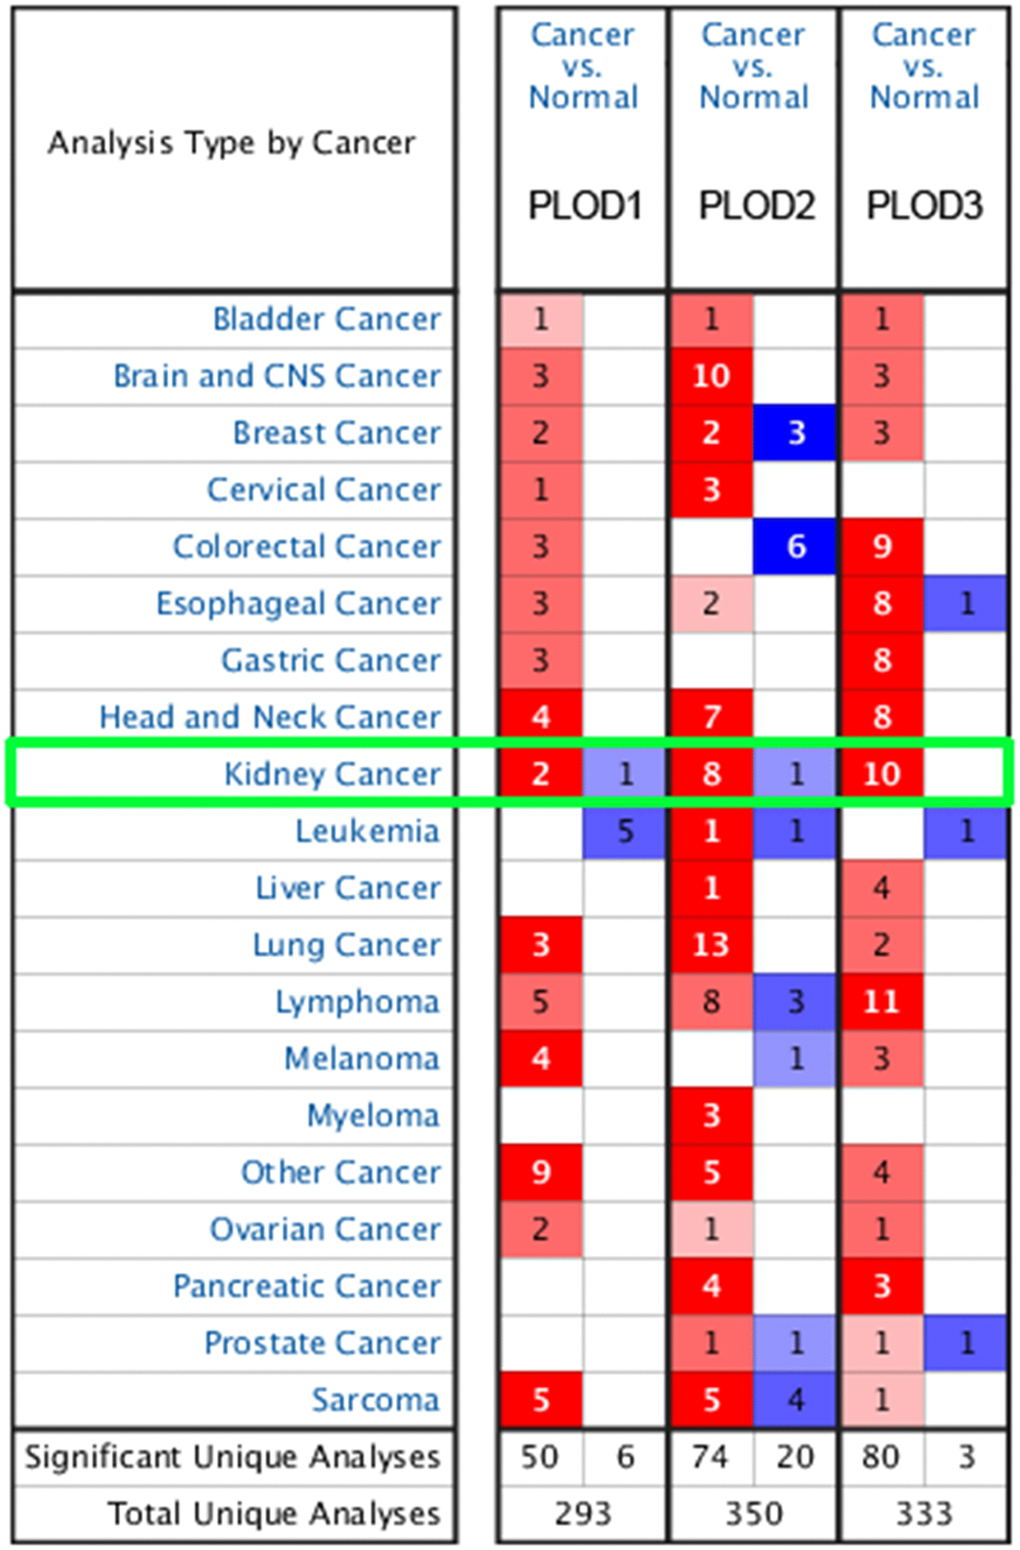
Figure 1.Transcriptional expression of PLODs in 20 different types of cancer diseases from Oncomine database. Difference of transcriptional expression was compared by Students’ t-test. Cut-off of p value and fold change were as following: p value=0.01, Fold Change=1.5, gene rank=10%, data type: mRNA.