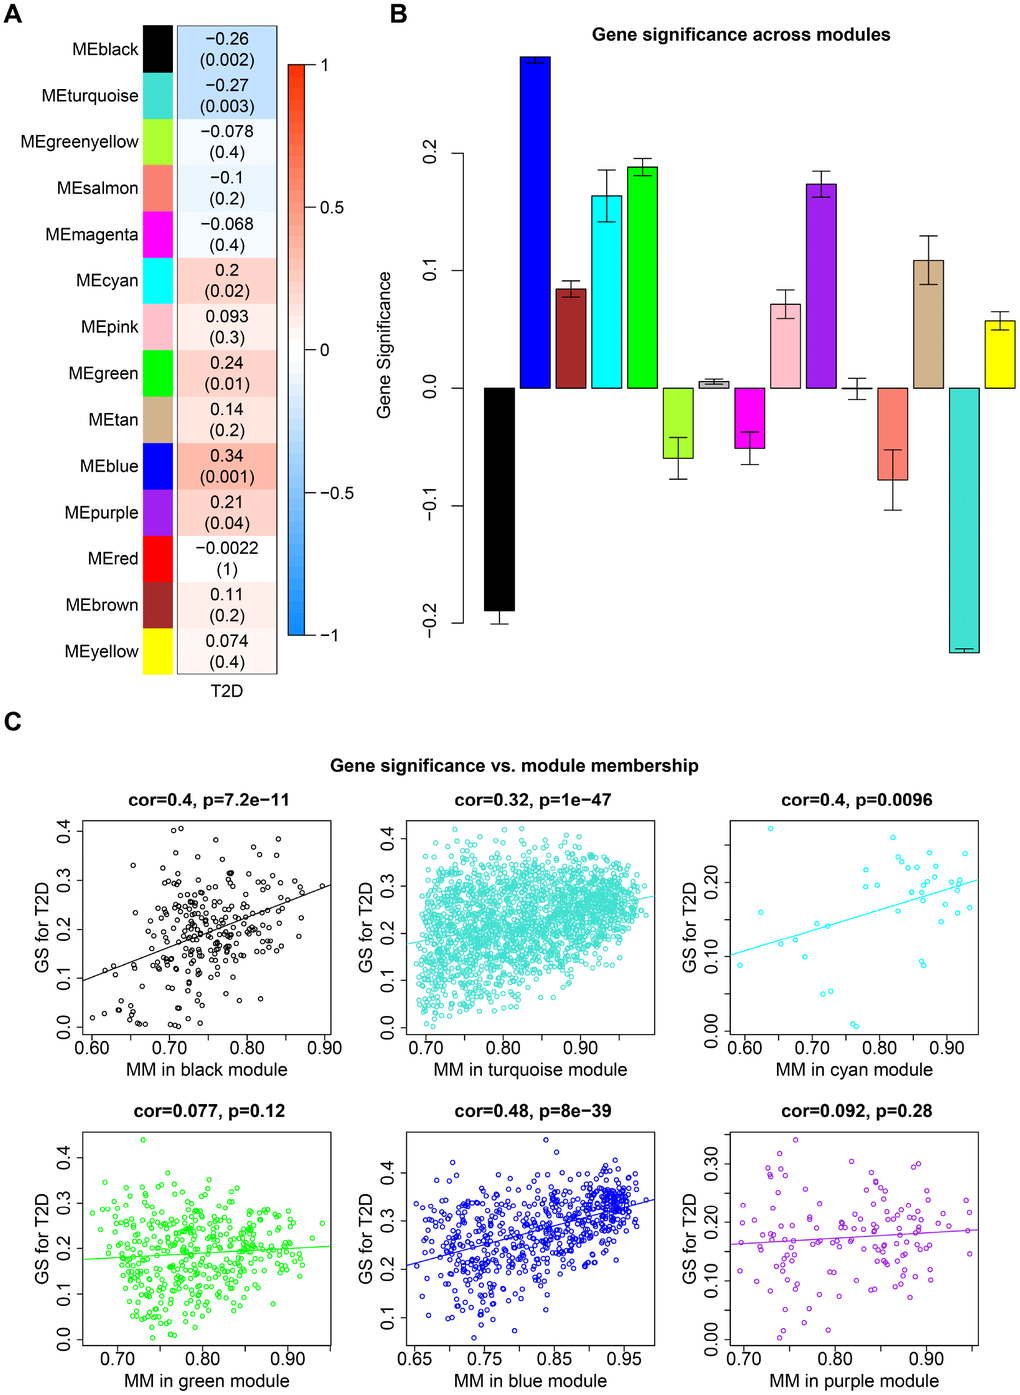
Figure 3.Co-expression modules in caudate. (A) Each row corresponds to a module eigengene and column indicate T2D status. The table were colored by correlation according to the legend. Each cell contains the corresponding correlation and P-value. (B) Each bar indicates the average of gene significance measure for all genes in a given module. (C) GS vs. MM plot for modules significantly correlated with T2D status. Each point corresponds to an individual gene within a given module, which was plotted by GS on the y-axis and MM on the x-axis. The regression line, correlation value and P-value were shown for each module.