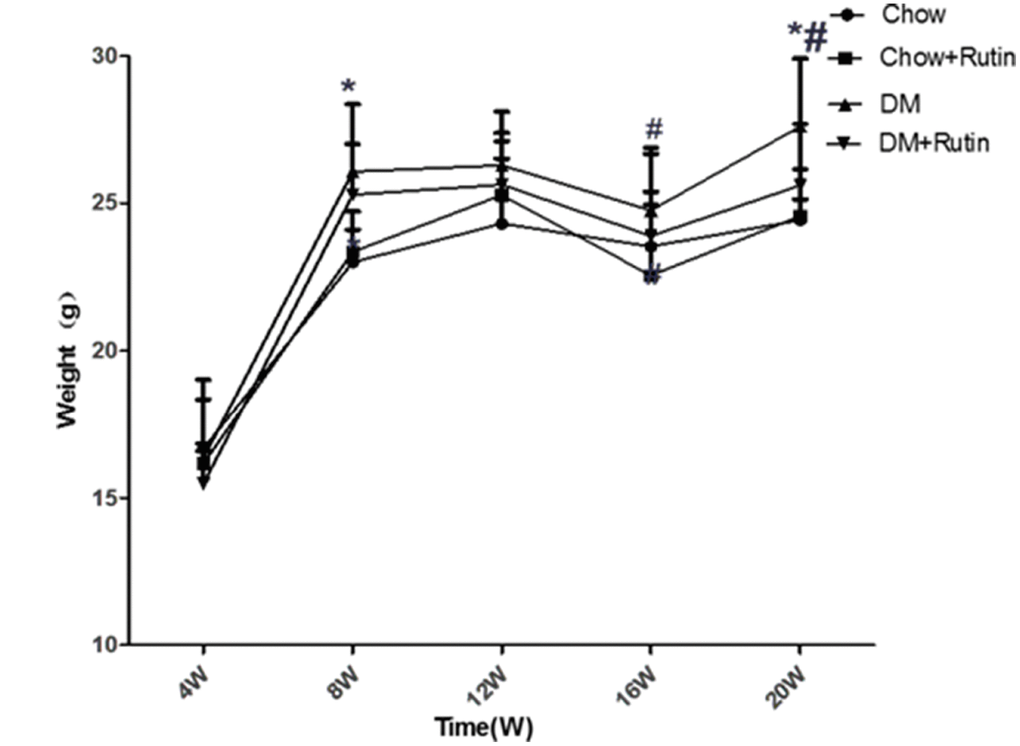
Figure 2.ApoE-/- body weight variation. Measurement of the body weight of mice, *P < 0.05, versus Chow, #P < 0.05, versus Chow + Rutin. Chow, normal group; Chow + Rutin, normal diet plus rutin; DM, Diabetic group; DM + Rutin, diabetic group plus rutin (n = 4–19). Data were analyzed using one-way ANOVA.