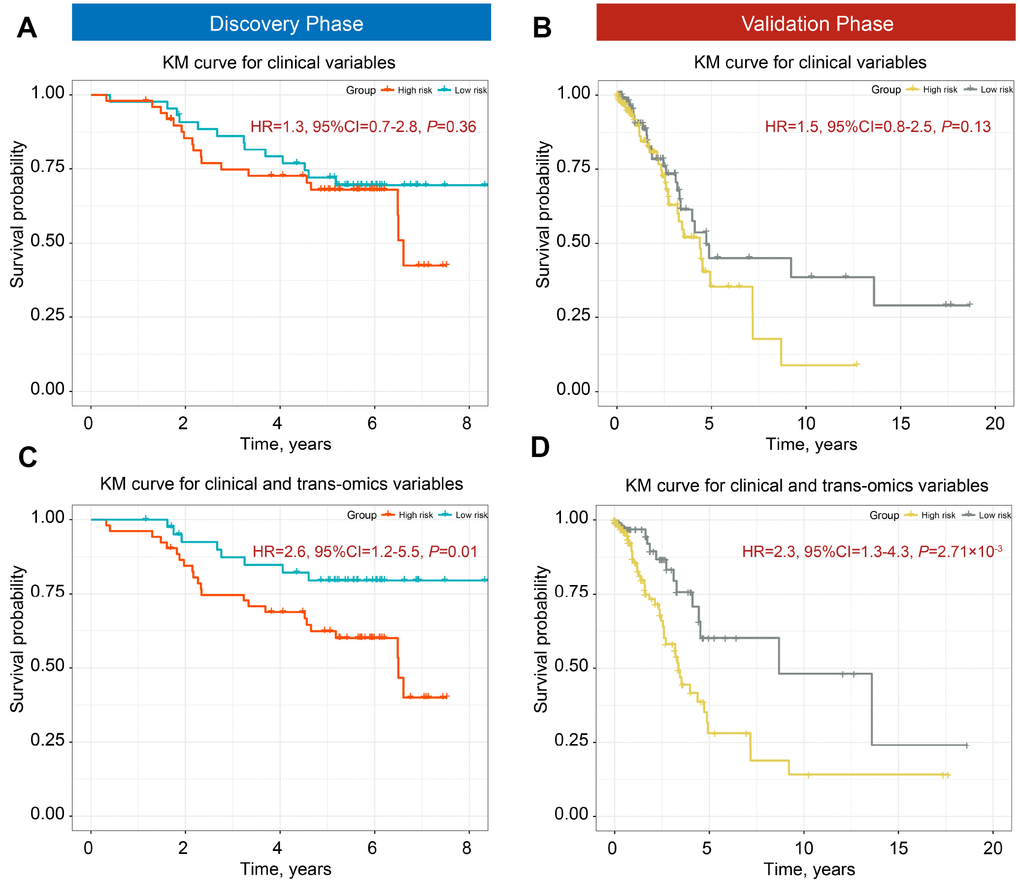
Figure 3.Kaplan-Meier (KM) survial curves of high- and low-mortality risk groups divided by iCluster. Classification ability of clinical information for discovery (A) and validation phases (B). Distinction ability of clinical information adding trans-omics biomarkers of DNA methylation and gene expression for the discovery (C) and validation phases (D).