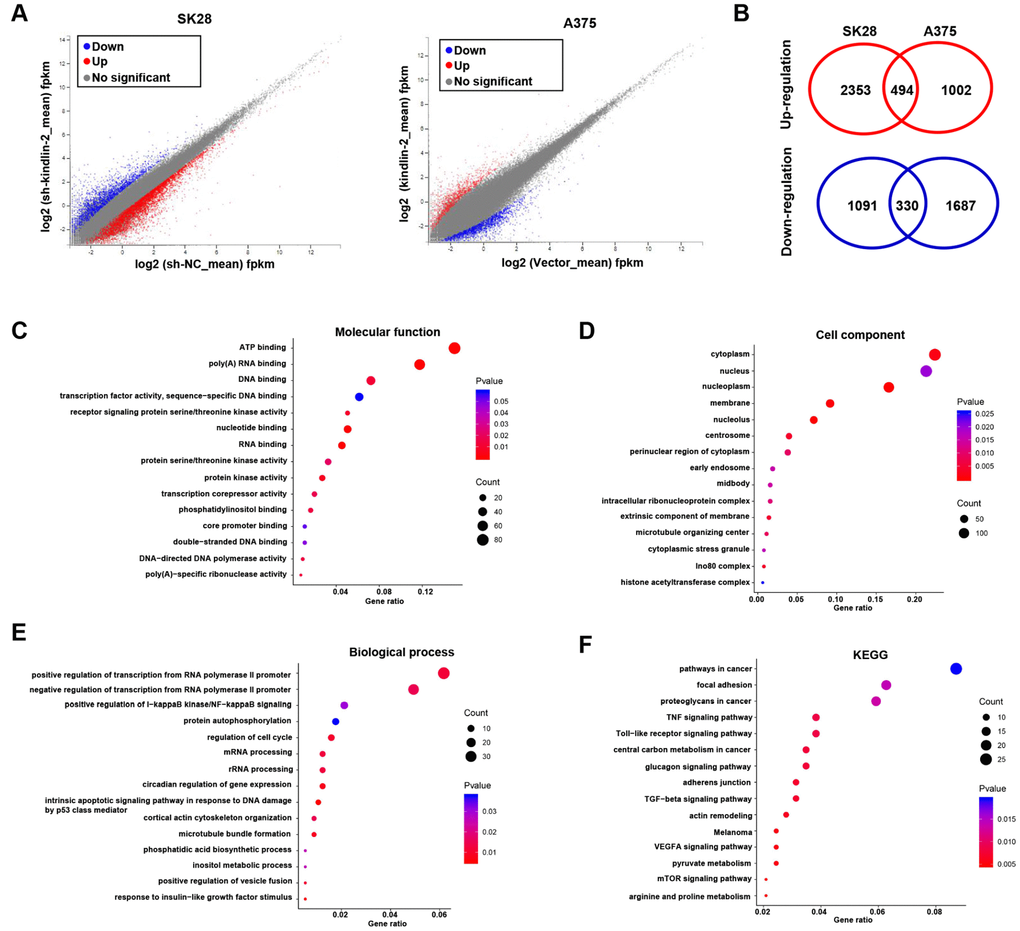
Figure 5.RNA sequencing and bioinformatics analyses. (A) Differentially expressed genes in SK28-shNC/SK28-sh-kindlin-2 and A375-Vector/A375-kindlin-2 cells were showed by volcano plots. (B) Venn diagrams were constructed to show the overlapping upregulated (red) and downregulated (blue) DEGs. (C–F) Gene Ontology (Molecular function, cell component and biological process) and KEGG analyses of the overlapping DEGs were performed.