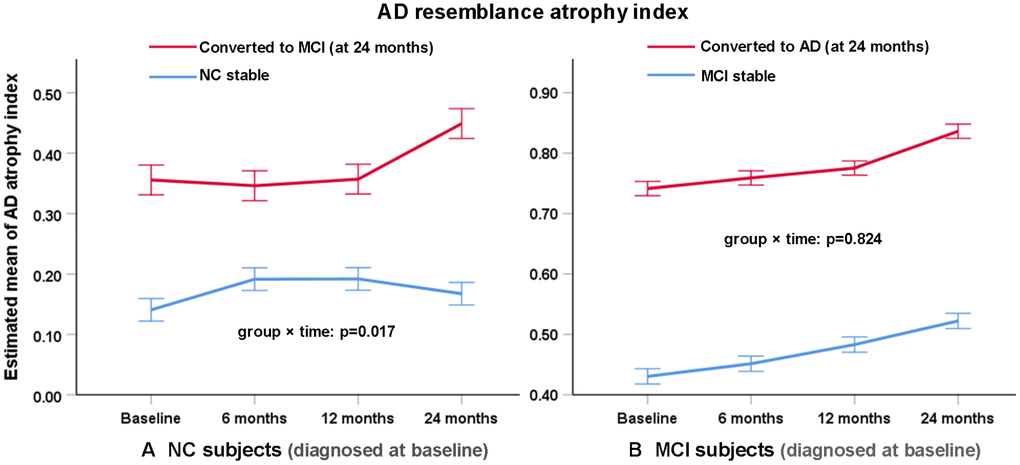
Figure 3.Change of AD resemblance atrophy index of (A) NC and (B) MCI subjects as diagnosed at baseline over two years. Figure shows estimated mean change in AD atrophy index from baseline until 6, 12 and 24 months (higher scores suggest more severe atrophy). Error bars are standard errors. Mixed-model repeated-measures analyses were used to assess between-group differences (group × time interaction) in changes from baseline to 24 months.