Submit an Article
Navigate
Home
Editorial Board
Editorial Policies
Current Volume
Archive
Scientific Integrity
Publication Ethics Statements
Interviews with Outstanding Authors
Newsroom
Sponsored Conferences
Podcast
Contact
Special Collections
Submit an Article
Online ISSN: 1945-4589
Research Paper
|
Volume 11, Issue 16
|
pp. 6217–6236
Risk estimation before progression to mild cognitive impairment and Alzheimer’s disease: an AD resemblance atrophy index
Back to article
Figure 1
(1 of 6)
−
100%
+
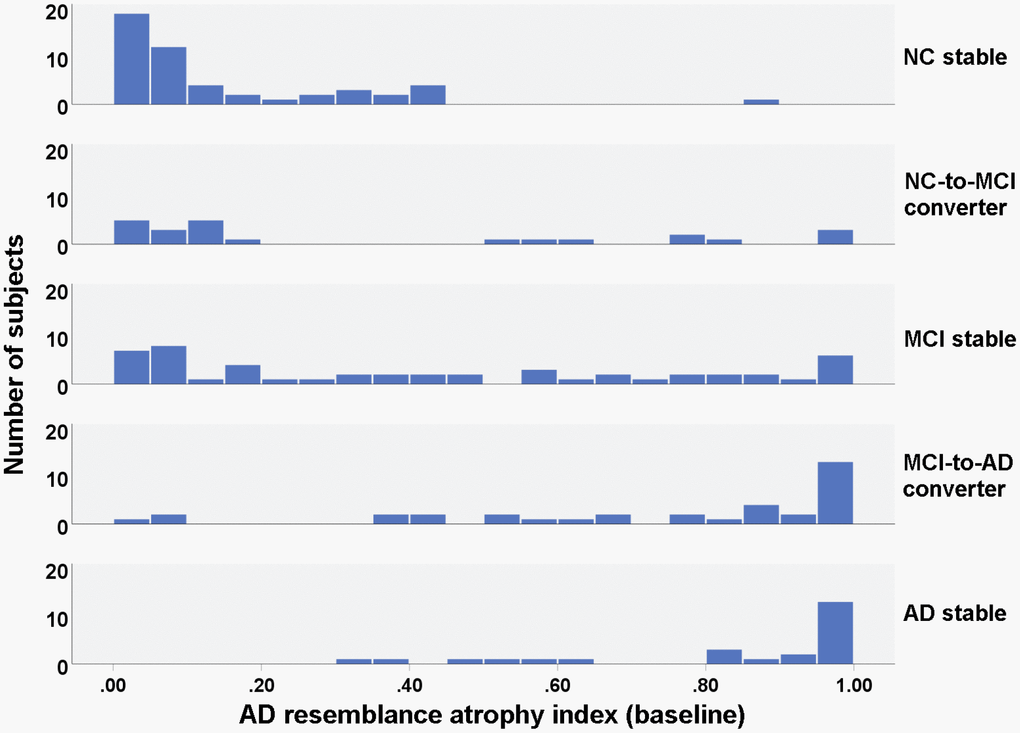
Figure 1.
Histogram of baseline AD resemblance atrophy index for different groups.