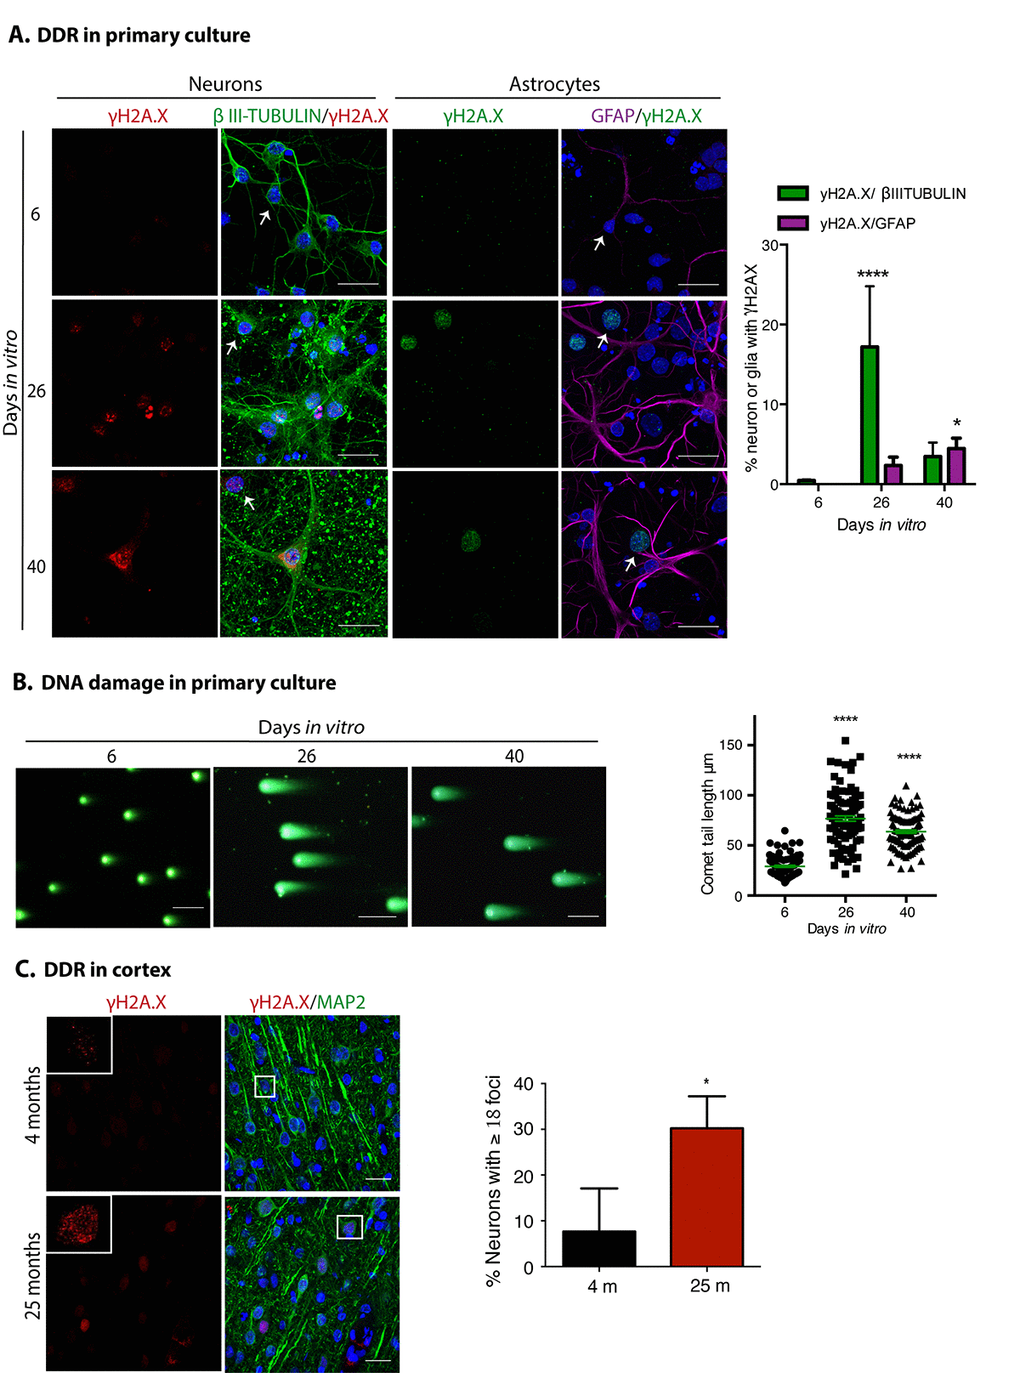
Figure 3.Neuronal cells in cortical long-term culture and in the cortex from old rat brains had a sustained DNA damage response (DDR). (A) Immunofluorescence to detect γH2AX foci in neurons (expressing βIII-TUBULIN) or astrocytes (expressing GFAP) in primary culture of cortical cells incubated during the indicated DIV. Notice that mostly neurons have γH2AX foci at 26 DIV. Scale bar represents 25 μm. Right, quantification of the percentage of neurons or glial cells with γH2AX foci over all cells. The mean of three independent experiments, each done by duplicate, is plotted. Bars represent SEM. Two-way RM ANOVA analysis, with Dunnett´s multiple comparison test. **** p< 0.0001 26 DIV vs. 6 DIV; * p<0.05 40 DIV vs. 6 DIV. Arrows indicate examples of cells with healthy nuclei counted (not all the healthy cells are indicated). (B) Comet assay to detect double strand breaks in genomic DNA from cells collected at the indicated days. Scale bars represent 100 μm. Right, the length of the tail of the comets, indicative of level of DNA damage, is plotted. 50 nuclei from each treatment, from two independent experiments, were analyzed by RM one-way ANOVA with Dennett’s´ multiple comparison. **** p< 0.0001 between 26 DIV or 40 DIV in comparison with 6 DIV. (C) Immunofluorescence to detect γH2AX foci in cortical neurons (expressing MAP2) in rat brains from the indicated age. Nuclei were stained with DAPI. Scale bars represent 30 μm. Right, percentage of neurons with more than 18 foci per nucleus. More than 100 neurons were counted from 3 different brains of each age. Bars represent standard deviation. Unpaired t Test * p<0.01.