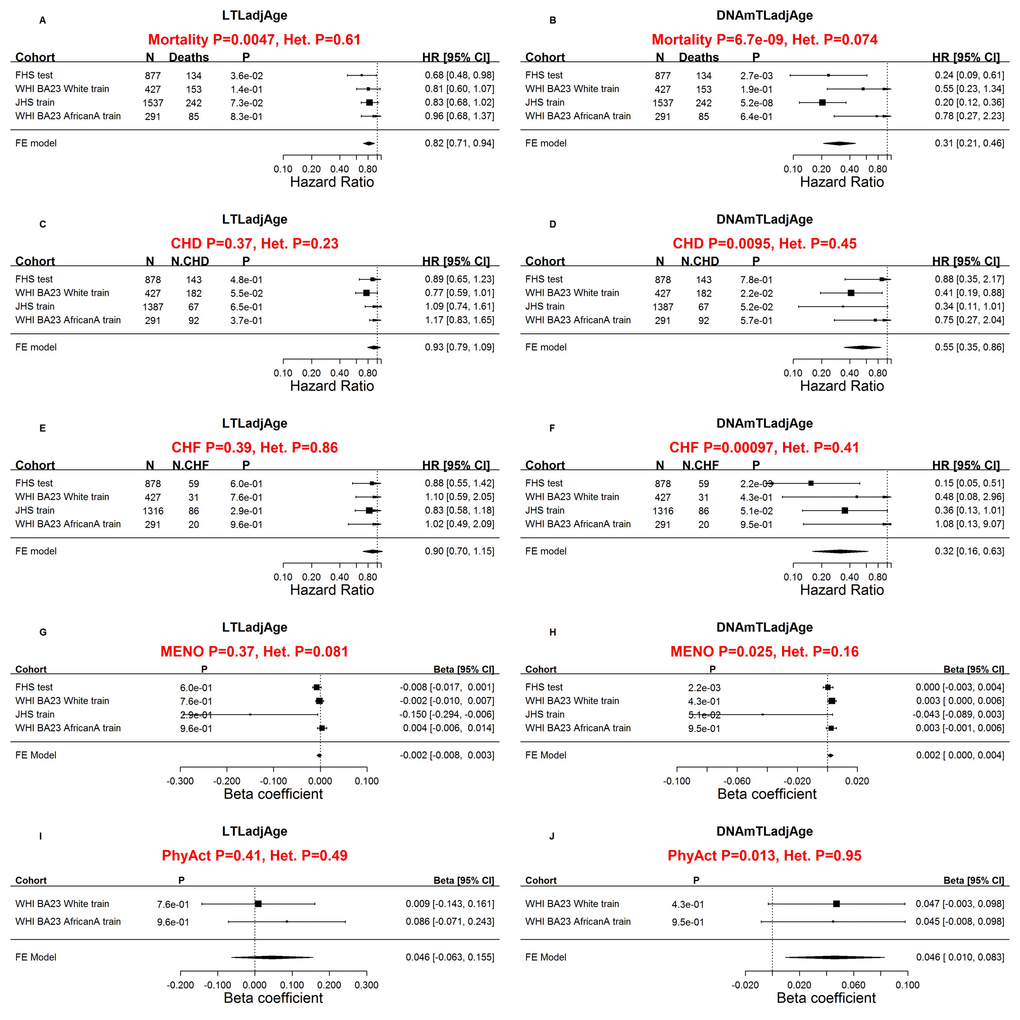
Figure 3.Comparing measured LTL with DNAmTL with respect to age-related conditions. Meta-analysis forest plots for relating age-related conditions (rows) to age-adjusted LTL (left panels) and age-adjusted DNAmTL (right panels). Panels in the first row (A, B) presents meta-analysis forest plots for Cox regression models of time-to-death. Meta-analysis of Cox regression models for (C, D) time-to-coronary heart disease (CHD) and (E, F) time-to-congestive heart failure (CHF). Rows in the forest plot correspond to training and test datasets (used for developing DNAmTL) stratified by race/ethnicity Each row presents the summary statistic at a (stratified) study da.taset and reports sample size (N), number of events, P value, hazard ratio and a 95% confidence interval resulting from a Cox regression model. (G, H) Meta-analysis for the association with age at menopause. (I, J) Meta-analysis for the association with self-reported physical activity status (yes/no). (G-J) Each row (study data set) presents the summary statistic, P value, beta coefficient and a 95% confidence interval resulting from a linear (mixed) regression model. In general, an insignificant Cochran Q test p-value (denoted by Het. P) is desirable because it suggests that results do not differ significantly across the strata. However, an insignificant Q test p-value could also reflect lack of statistical power.