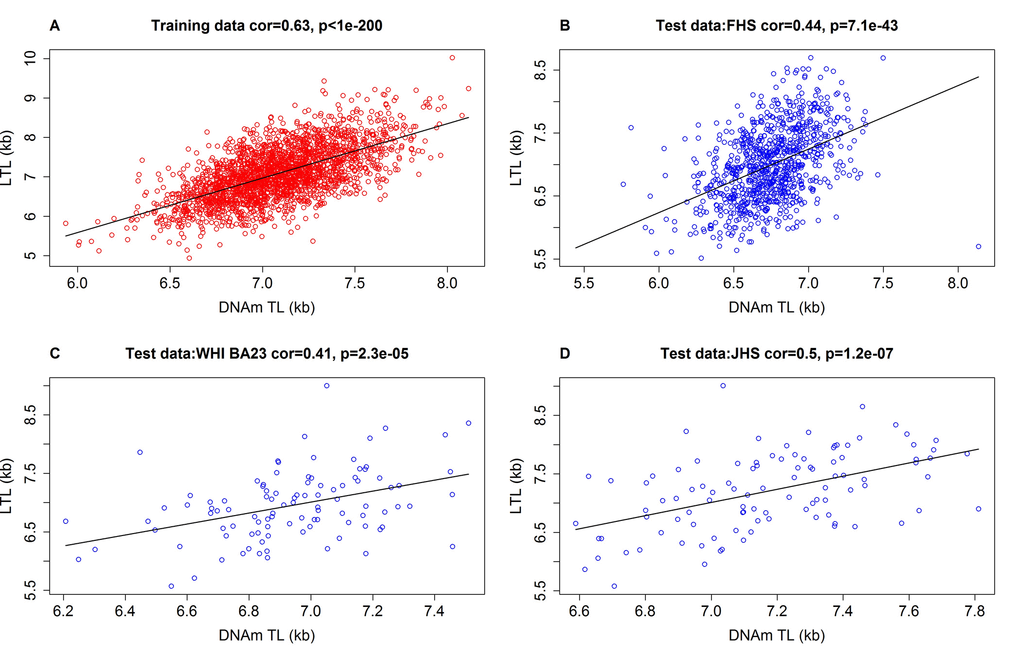
Figure 1.Measured LTL versus DNAmTL in training and test datasets. Scatter plots of DNA methylation-based telomere length (DNAmTL, x-axis) versus observed LTL measured by terminal restriction fragmentation (y-axis). DNAmTL and LTL are in units of kilobase (kb). (A) Training data. (B) Test data from the Framingham Heart Study. (C) Test data from the Women's Health Initiative (BA23 sub-study). (D) Test data from the Jackson Heart Study. Each panel reports a Pearson correlation coefficient and correlation test p-value. Table 1 reports analogous results for additional cohorts (Bogalusa, Twins UK, etc).