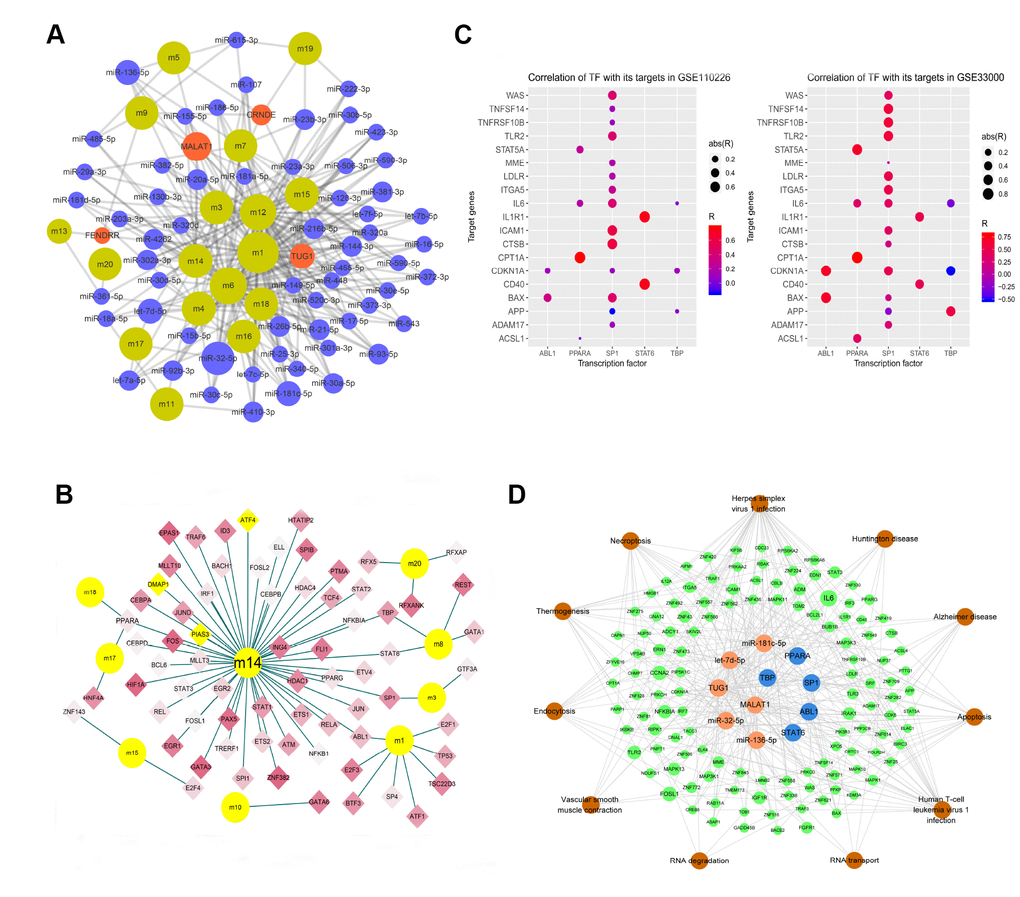
Figure 4.Modular network regulation map of gene-related ncRNA/TFs. (A) Map of gene module regulation by ncRNAs. Brown indicates modules; red, long non-coding RNA; and blue, microRNA. The size of the node reflects the node's degree. (B) Map of modular genes and the TFs regulating them. Yellow dots indicate modules; diamonds, transcription factors; red, genes upregulated in AD; and blue, genes downregulated in AD. Yellow diamond nodes indicate expression that is not significantly different between AD and control samples. (C) Correlation of TFs with their targets. Abbreviations: abs, absolute value; R, Pearson correlation coefficient. (D) Integrated regulatory network of ncRNA/TF-target genes-pathways. Orange indicates non-coding RNA; blue, TF; green, module gene; and brown, pathway.